Ceramic materials research
DLP-printed TiO₂/ZrO₂–Al₂O₃ ceramics: 326 MPa flexural strength
A research-based review of a 50 vol% VPP slurry, 1550 °C sintering, 97.89% density and geometry-dependent strength in reinforced alumina ceramics.
Localized technical adaptation of the supplied article. The values and figures belong to the cited paper and are not KUNWU equipment specifications, guaranteed process results or application certification.
- Relative density
- 97.89%
- Flexural strength
- 326.10 MPa
- Hardness
- 13.24 GPa
Alumina is valued for heat resistance, electrical insulation and structural stability, yet its brittleness and the difficulty of machining complex shapes constrain small-batch development. A 2026 study combined vat photopolymerization (VPP/DLP) with TiO₂/ZrO₂ reinforcement and a tailored 1550 °C sintering schedule. Under the reported conditions, a six-hour hold produced 97.89% relative density, 326.10 MPa flexural strength and 13.24 GPa hardness. These values belong to the cited research system—not to every alumina formulation or to KUNWU equipment.
1. A printable 50 vol% ceramic slurry
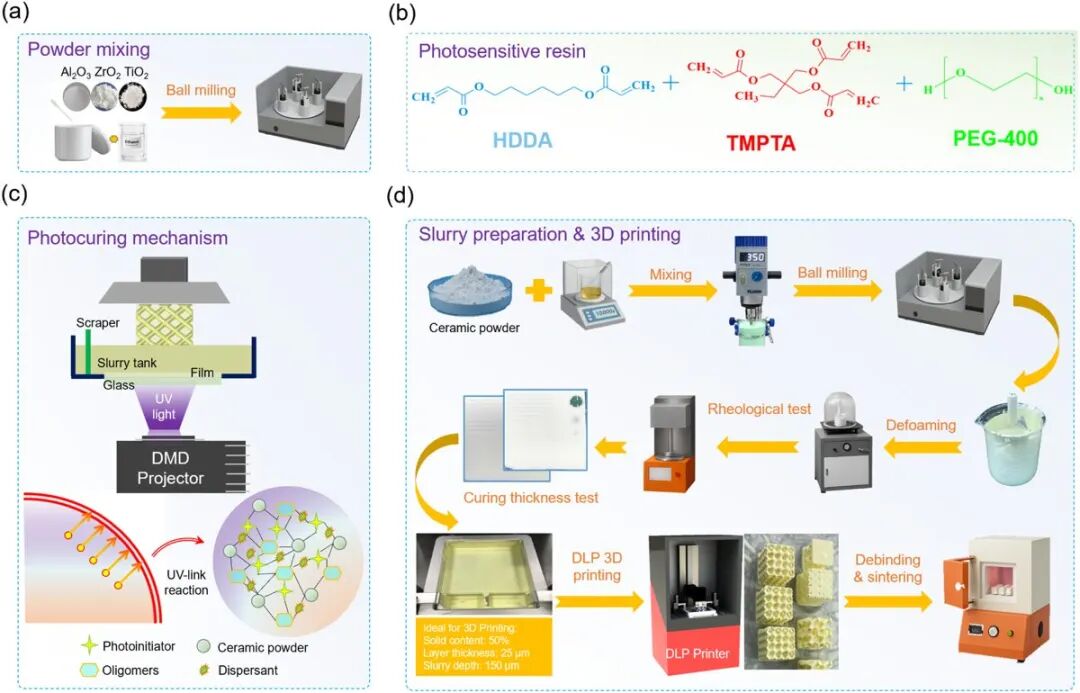
The authors formulated a 50 vol% photosensitive suspension using alumina with TiO₂/ZrO₂ reinforcements and an HDDA/TMPTA/PEG-400 resin system. The rheology is strongly shear-thinning: viscosity falls rapidly as shear rate rises, which supports spreading during recoating while helping the layer remain stable after motion stops. Curing depth increased approximately linearly with logarithmic exposure energy over the measured window.
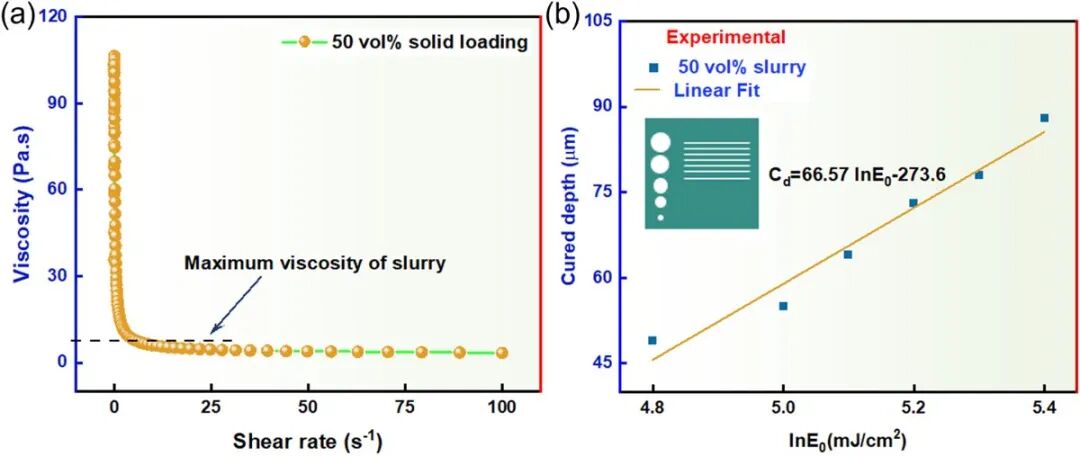
The published printing parameters were 21.3 mW/cm² light intensity, ten seconds for the base layer, nine seconds for subsequent layers and 25 μm layer thickness. These settings are a study-specific starting point. Optical absorption, powder size distribution, pigment content, machine optics and separation force all change the usable window.
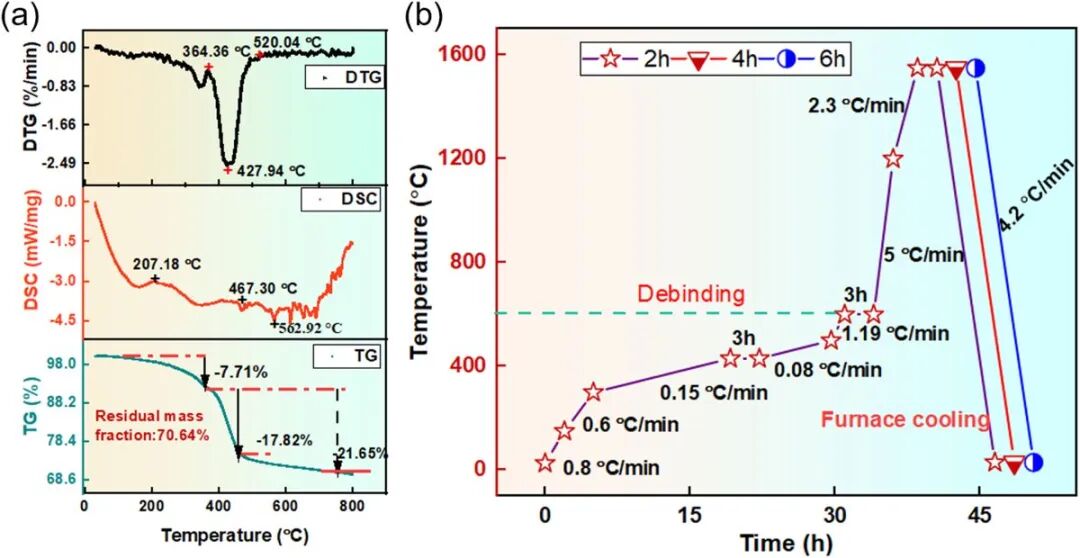
2. Debinding and a controlled 1550 °C hold
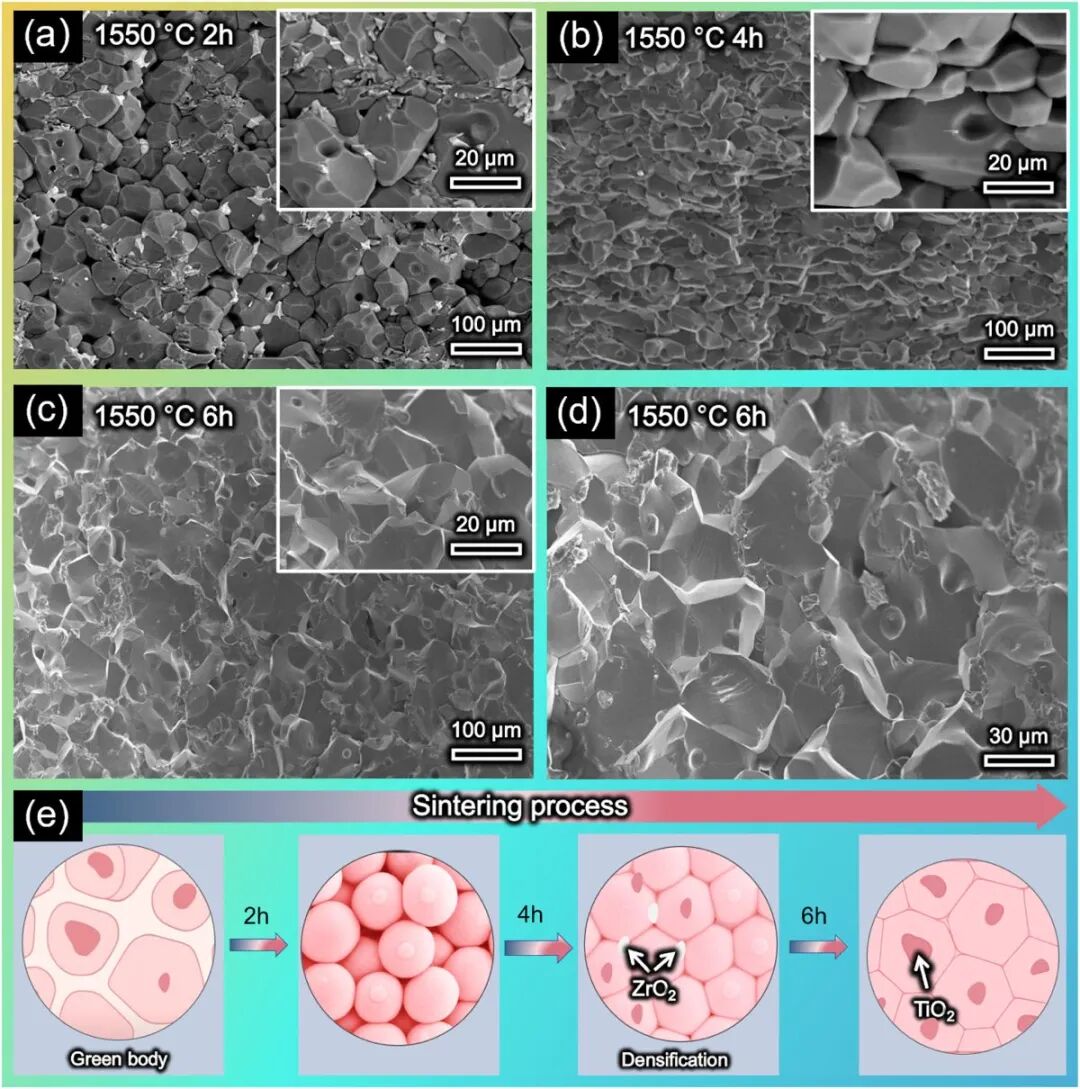
Thermal analysis was used to design a multistage debinding cycle before sintering. The heating path slows through the main decomposition region and includes holds to reduce pressure from evolving gases. Three sintering groups were then held at 1550 °C for two, four or six hours. Longer holding improved densification, but it also changed shrinkage, mass loss, grain structure and surface condition; time therefore cannot be optimized from density alone.
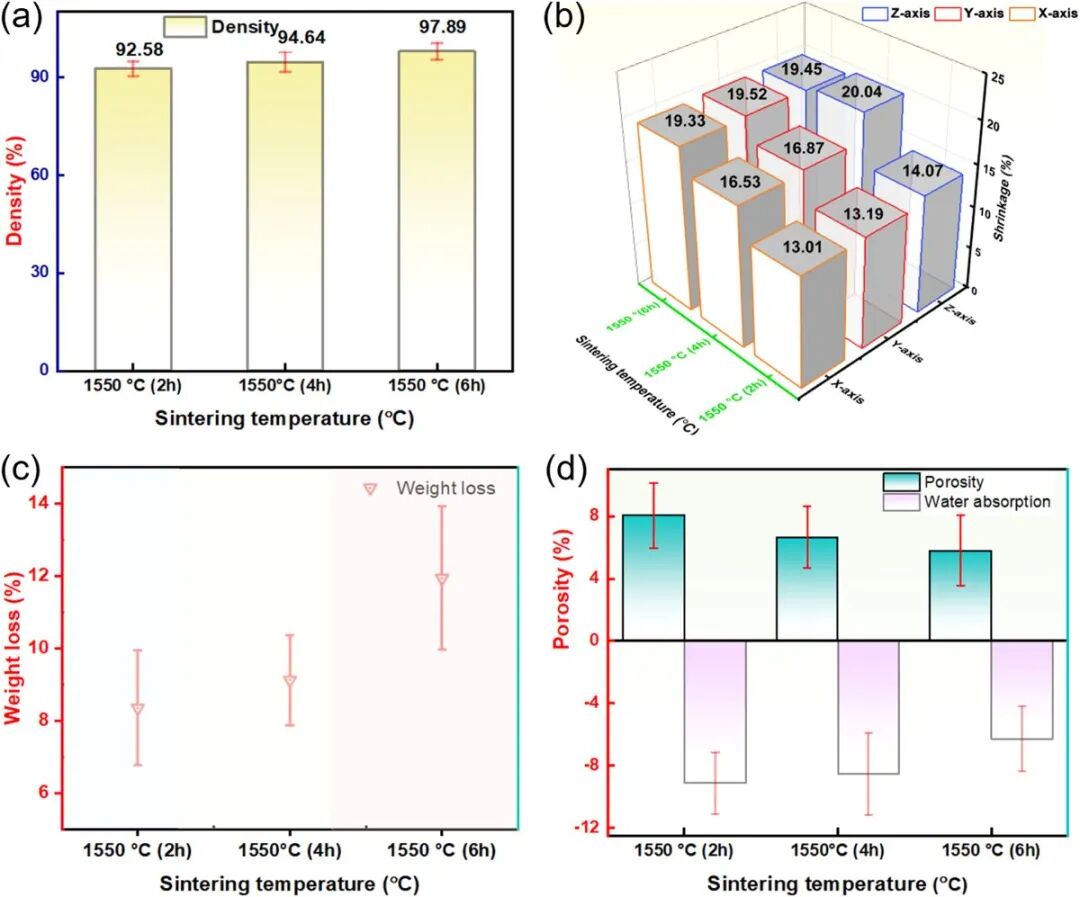
3. Density, shrinkage and surface quality
Relative density increased from 92.58% at two hours to 94.64% at four hours and 97.89% at six hours. The six-hour group showed directional shrinkage of about 19.33%, 19.52% and 19.45% along X, Y and Z in the source chart. Another reported minimum, 14.07%, belongs to a different direction/condition in the comparison and should not be treated as the universal compensation factor.
Surface roughness did not improve monotonically. Ra fell from approximately 6.118 μm at two hours to 4.030 μm at four hours, then rose slightly to 4.250 μm at six hours. This illustrates a practical trade-off: the densest condition is not automatically the smoothest. Orientation, support marks, layer stepping and finishing requirements must be evaluated separately.
4. Mechanical response and topology
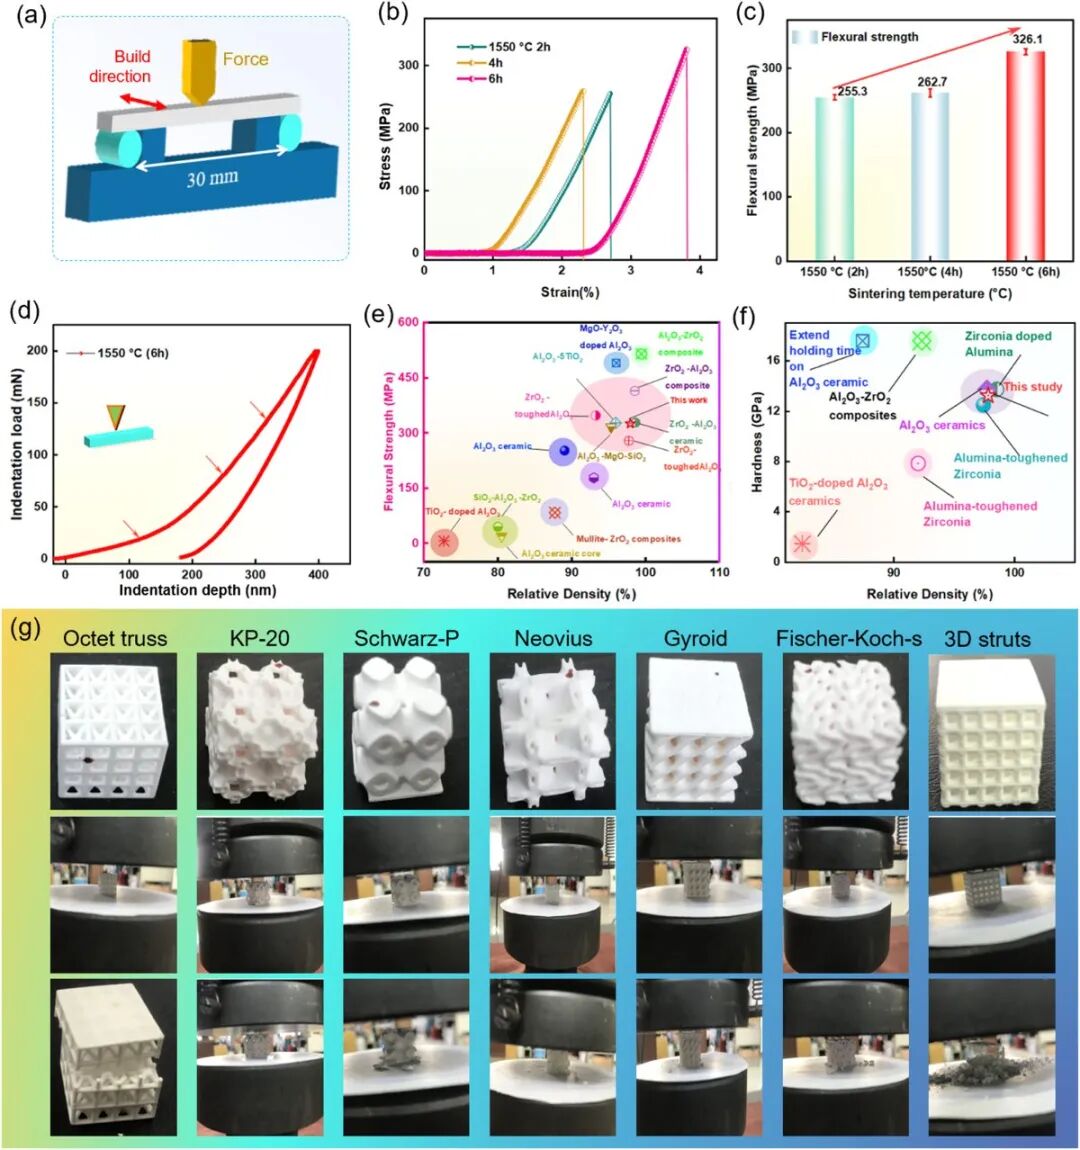
Flexural strength rose from about 255.3 MPa after two hours to 262.7 MPa after four hours and 326.10 MPa after six hours. The six-hour hardness reached 13.24 GPa. These results align with the measured rise in density and the observed evolution of grain boundaries and secondary phases, but they remain specimen-level results under the paper’s test method.
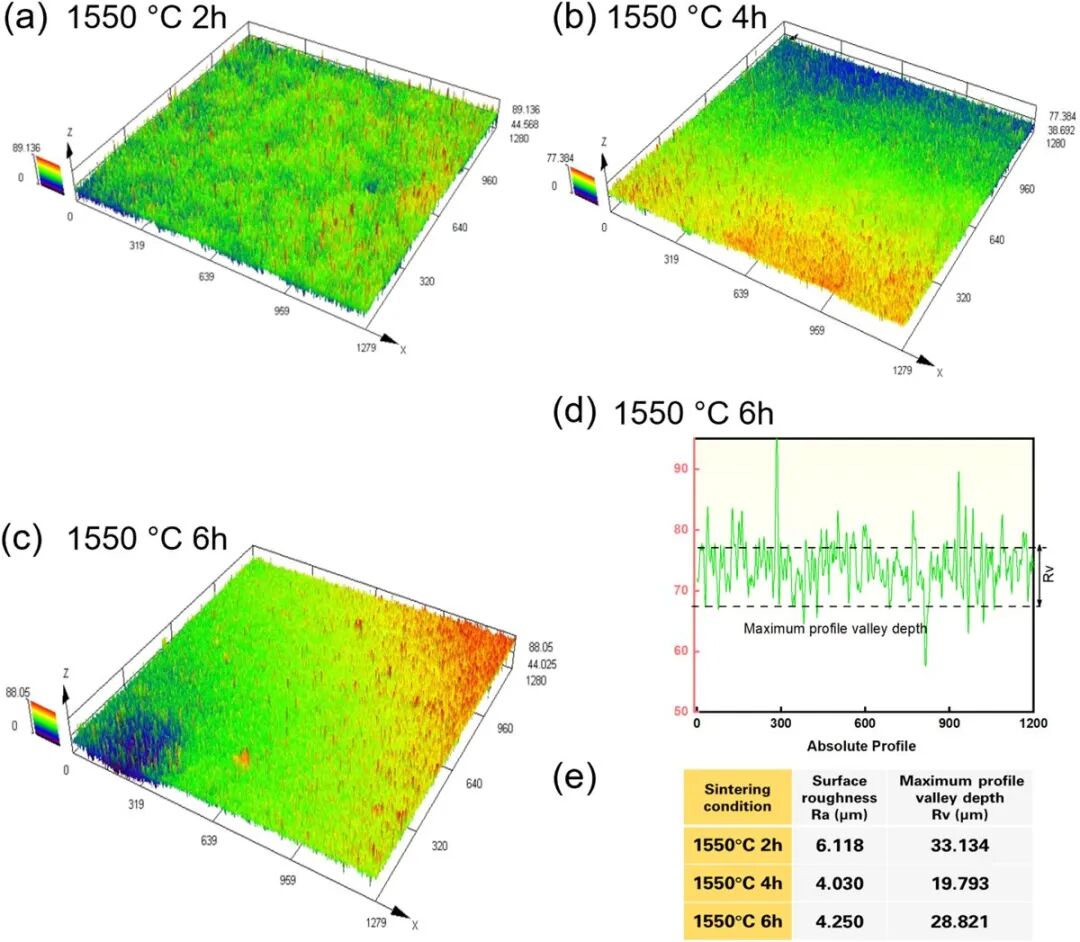
Table 1. Compression results for printed lattice examples
| Geometry | Reported compressive strength |
|---|---|
| Fischer–Koch S | 68.96 MPa |
| Gyroid | 33.79 MPa |
| KP-20 | 33.54 MPa |
| Neovius | 26.21 MPa |
| Schwarz-P | 11.15 MPa |
| Octet / 3D strut | 9.9 / 6.6 MPa |
The nearly tenfold span across the listed geometries shows why a material number cannot substitute for structural validation. Relative density, wall thickness, cell size, print orientation, load direction and boundary conditions all contribute. A catalyst support, heat-transfer insert or lightweight structural core therefore needs its own flow, thermal and mechanical acceptance criteria.
5. Phase and microstructure evolution
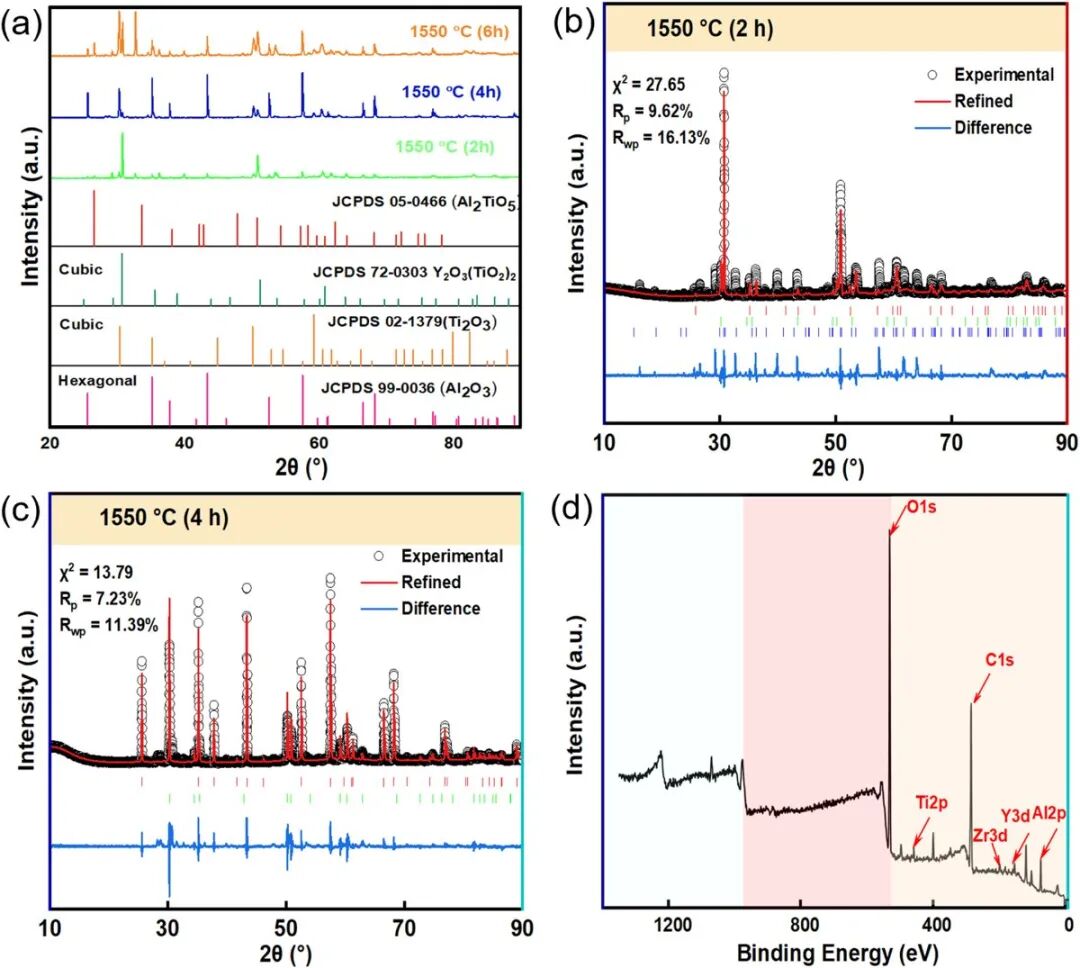
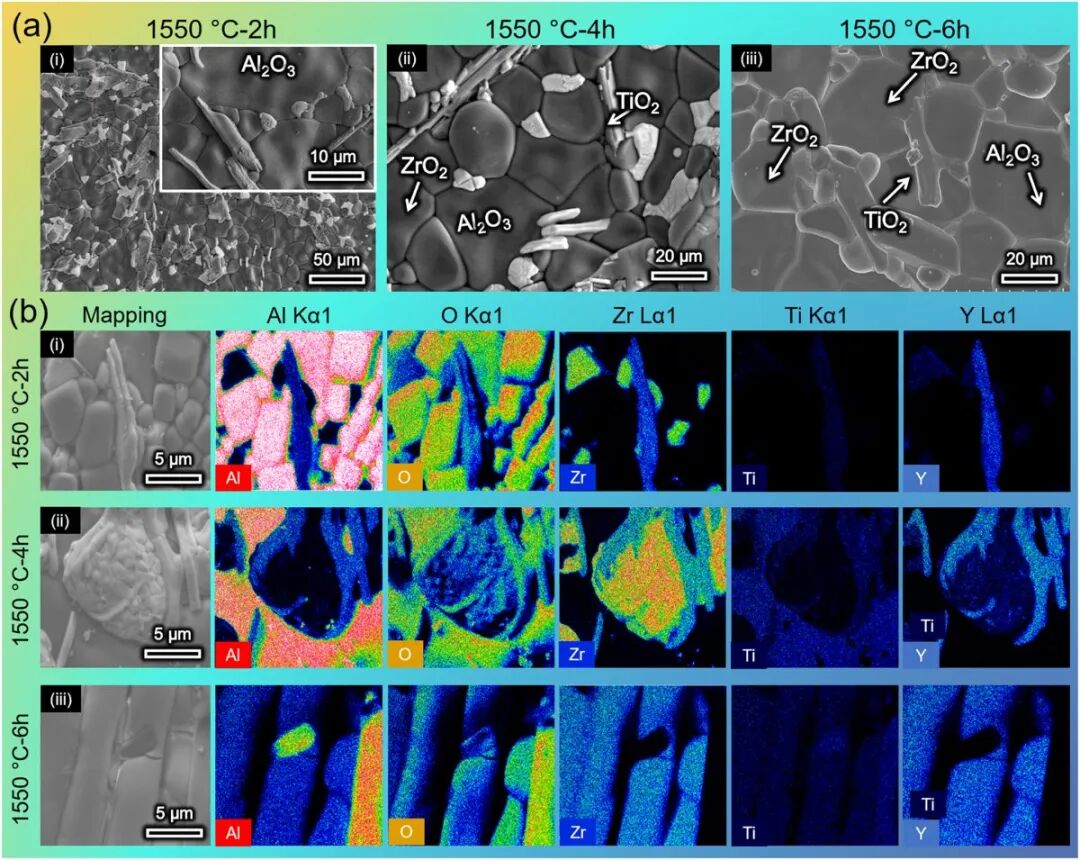
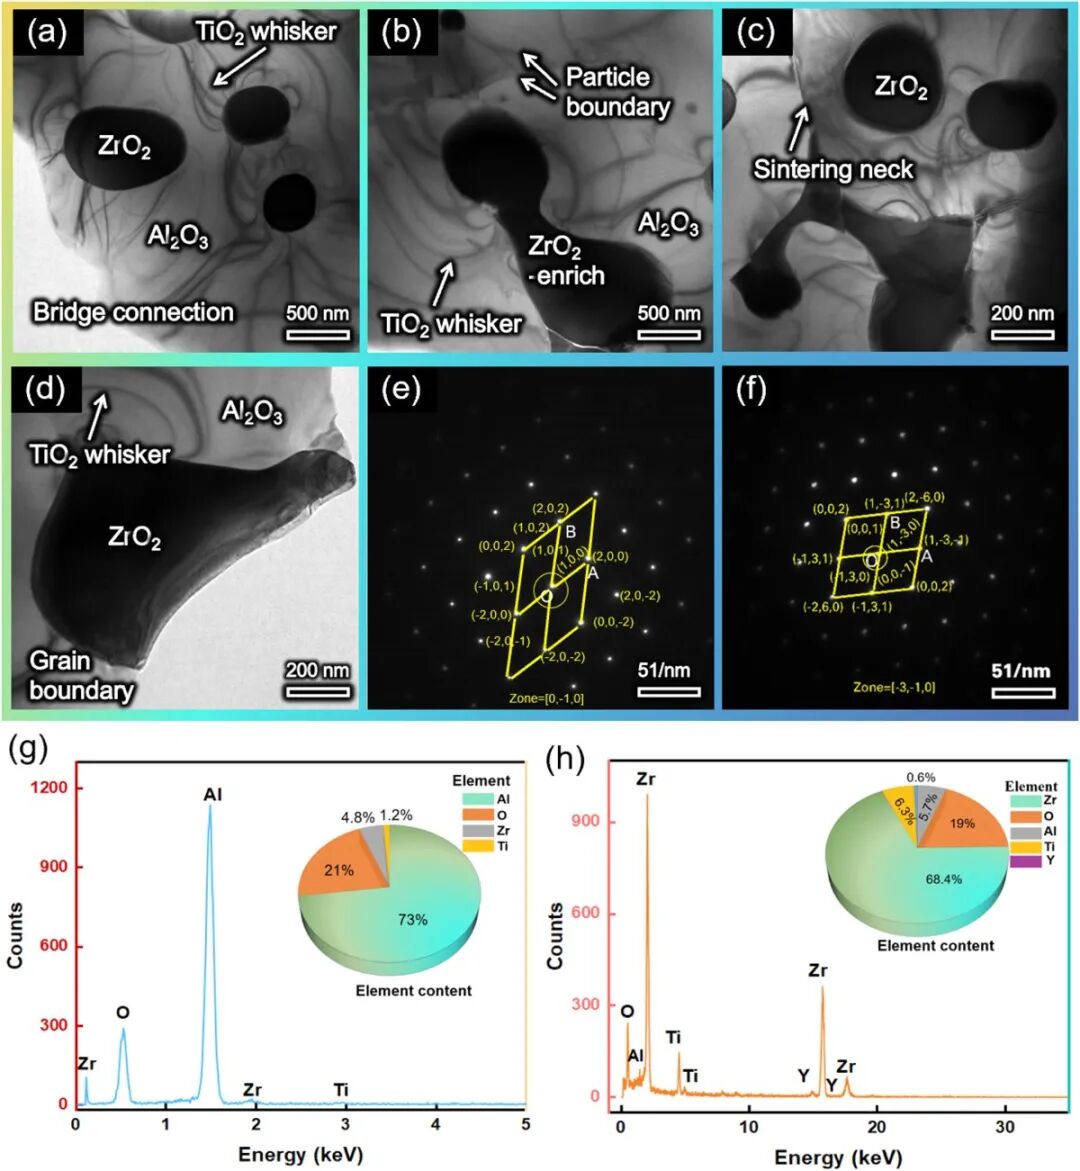
XRD/Rietveld refinement, XPS, SEM/EDS and TEM were used together. The source attributes the improved response to densification, refined and interlocked grains, TiO₂-derived whisker-like features, ZrO₂-rich regions and reinforced sintering necks. These observations support crack deflection and interface strengthening as mechanisms, but the exact contribution of each phase cannot be transferred to another powder or firing schedule without characterization.
6. What the complex parts demonstrate
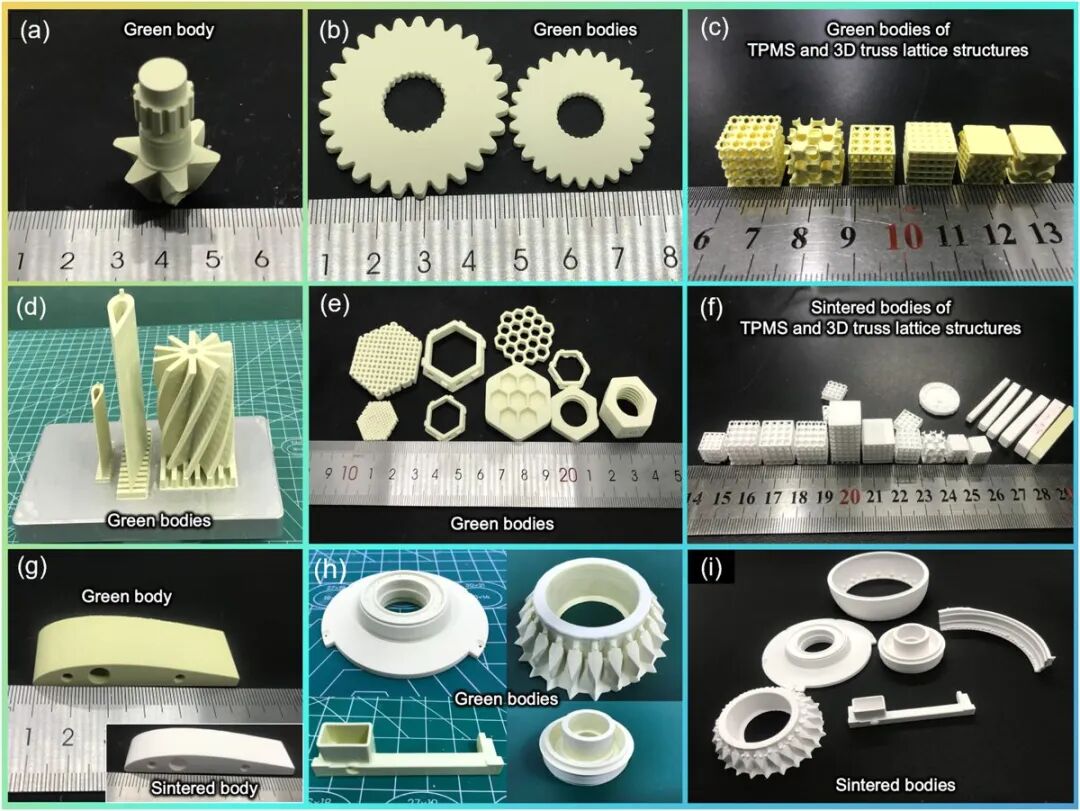
The paper shows gears, blades, honeycombs, TPMS cells, trusses and other green and sintered parts. Their value is geometric evidence: the slurry and thermal route produced multiple intricate forms. The images do not by themselves establish dimensional tolerance, fatigue life, chemical compatibility, pressure drop or qualification for aerospace, semiconductor, catalyst or biomedical service.
7. Practical route for a new part
For project planning, define the geometry and service environment first; then screen slurry stability and cure depth, print calibration coupons, design debinding from thermal analysis, and measure directional shrinkage after sintering. Final validation should use the real geometry and acceptance metrics—strength alone is insufficient. KUNWU can help organize a material–geometry–process trial, but feasibility and parameters must be confirmed for the customer’s actual powder, part and furnace route.
For catalyst scaffolds in particular, the target is rarely maximum bulk strength alone. Open porosity, accessible surface area, coating adhesion, pressure drop, thermal-shock resistance and chemical stability may pull the design in different directions. A useful trial plan therefore compares several cell structures at the same material and firing condition instead of selecting one topology from a single compression value.
Sources
Original paper · DOI
Hussain MI, Xia M, Chen Z. Microstructure control and nanoengineering reinforcement of additively manufactured TiO₂/ZrO₂–Al₂O₃ ceramics. International Journal of Mechanical Sciences. 2026;326:111911.