Ceramic processing
Lithium ceramics: six pebble routes and DLP 3D printing
Compare lithium ceramics, six pebble-forming routes and DLP 3D printing, with source tables, original figures and clearly stated research limitations.
Localized technical adaptation of the supplied article, with editorial checks. Research results belong to the cited publications; they do not establish KUNWU equipment performance or nuclear-service qualification.
Lithium-based ceramics are being studied as solid tritium-breeding materials for civilian fusion energy. Their usefulness depends not only on lithium content, but also on thermal stability, irradiation behaviour, gas release and mechanical integrity. Forming and post-processing therefore matter as much as composition. This article follows a supplied Chinese technical overview of the review by Ali and colleagues: five candidate ceramics, six conventional pebble-making routes, and vat photopolymerization (VPP) of pebbles and architected structures.
1. Why lithium ceramics are considered for fusion
In deuterium–tritium fusion, deuterium is available from water, whereas tritium is scarce. Neutron interactions with lithium underpin the solid-breeder concept. In a helium-cooled pebble-bed (HCPB) blanket concept, a bed of ceramic pebbles provides connected voids for gas transport. The review examines the materials and manufacturing issues associated with this concept, rather than a commercially qualified reactor component.
Figure 1 combines publication and citation trends for 2018–2025, a market forecast, a fuel-source chart and the review scope. The supplied text quotes a fusion-market projection of USD 376 billion in 2025 and USD 1 trillion in 2050, alongside shares of 68% for D–T and 2% for lithium ceramics. These are source-reported illustrative estimates; their market definitions and denominators were not independently established and they should not be used as verified market statistics.
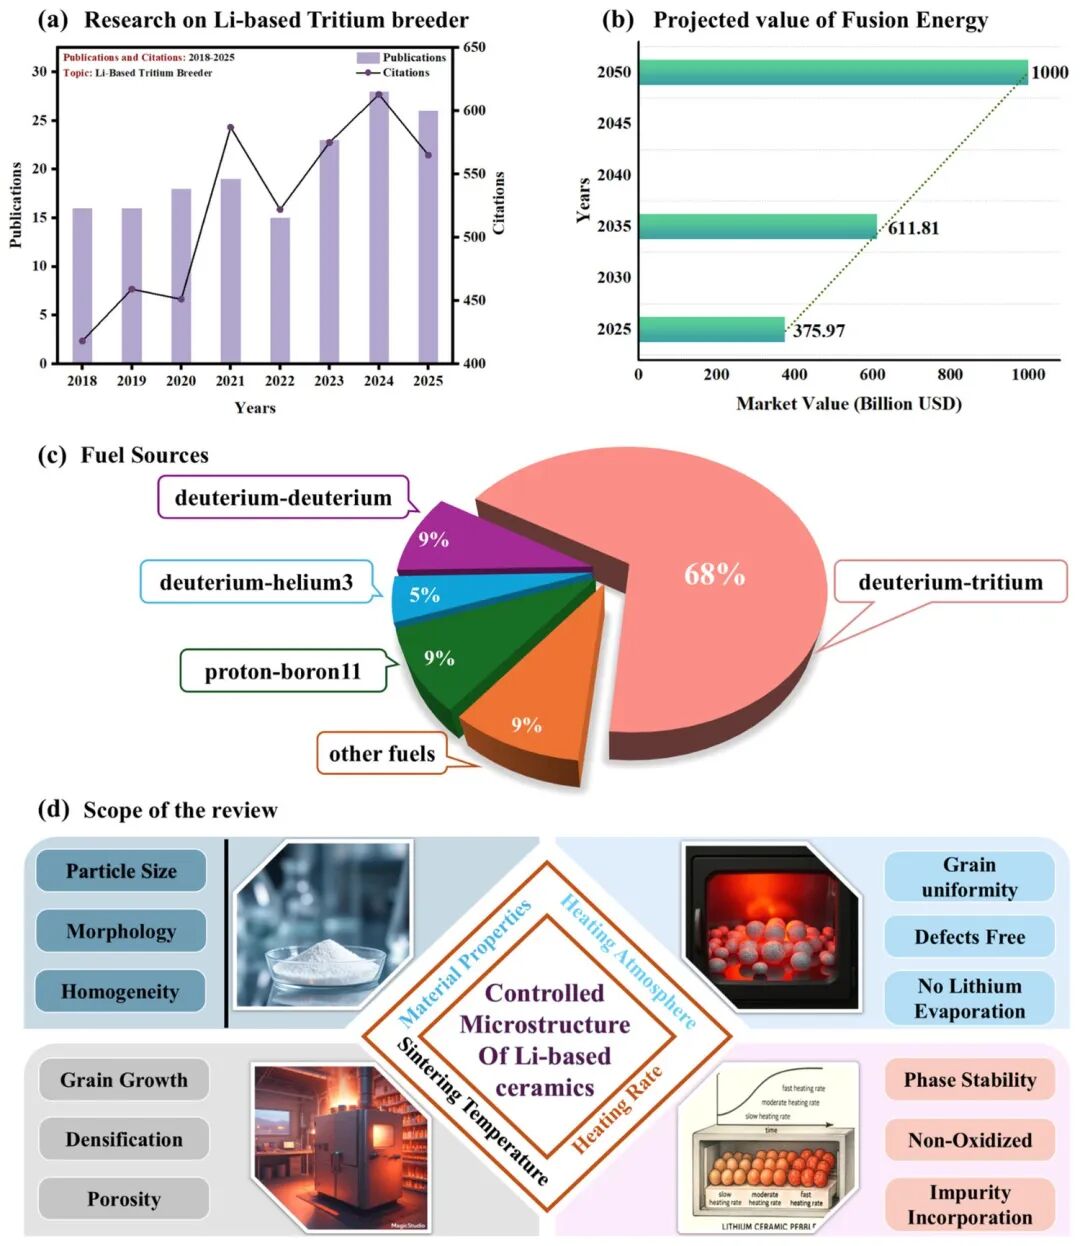
The main candidates are Li4SiO4 (lithium orthosilicate, LSO), Li2TiO3 (lithium metatitanate, LTO), Li2O, LiAlO2 and Li2ZrO3. LSO and LTO receive particular attention. Li2O has high lithium density but is moisture-sensitive and can lose more mass at elevated temperature; LiAlO2 has much lower lithium density. Table 1 reproduces the source comparison. The qualitative breeding ratings are not reactor-specific performance guarantees.
Table 1. Source-reported properties of five lithium ceramics
| Material | Melting point (K) | Lithium density (g/cm³) | Thermal conductivity at 500 °C (W/m·K) | Tritium release (°C) | Operating interval (°C) | Breeding rating | Mass loss at 1000 °C |
|---|---|---|---|---|---|---|---|
| Li2O | 1692 | 0.94 | 4.7 | >400 | 400–800 | High | 3–6 wt% |
| Li2TiO3 | 1808 | 0.43 | 1.8 | >300 | 352–1100 | Medium | 0.3–0.8 wt% |
| Li2ZrO3 | 1888 | 0.38 | 0.75 | >450 | 400–1400 | Medium | 0.5–1.0 wt% |
| Li4SiO4 | 1523 | 0.51 | 2.4 | >350 | 310–950 | Medium | 0.2–0.5 wt% |
| LiAlO2 | 1883 | 0.20 | 2.4 | >400 | 500–1200 | Low | 0.2–0.5 wt% |
2. Material requirements and pebble-bed constraints
The source discusses melting point, thermal conductivity, expansion, stiffness, hardness and fracture toughness together. Representative values include thermal conductivity of 2–5 W/m·K, thermal expansion of 8 × 10⁻⁶ to 14 × 10⁻⁶ K⁻¹, elastic modulus up to 200 GPa, hardness up to 7 GPa and toughness of 0.8–2 MPa·m½. These are examples across materials and conditions, not specifications shared by every entry in Table 1; that table also contains lower conductivities. Melting temperatures must not be confused between kelvin and degrees Celsius.
Phase purity, grain size and connected porosity affect both release behaviour and strength. Long-term phase evolution, including possible Li2SiO3 formation from LSO under particular conditions, matters; closed pores may hinder gas release. The source also gives approximately 2.4 g/cm³ for Li4SiO4 and 4.6 g/cm³ for Li2ZrO3. These values describe ceramic density, not the lithium mass per unit volume listed in Table 1. The two quantities must remain distinct.
A randomly packed bed of similar spheres is often discussed near a packing fraction of 64%; this is not an absolute upper bound for all sphere arrangements. Point contacts concentrate stress, while thermal cycling can cause cracking, rearrangement and irreversible compaction. Additive manufacturing is interesting because geometry, contact area and pore connectivity can be designed together instead of accepting a random bed as the only option.
3. Six conventional routes for making ceramic pebbles
The review traces development from solid-state routes in the 1970s to later chemical, granulation and melt-based processes. Roundness, size distribution, density, pore structure, crushing load and lithium loss are the recurring trade-offs.
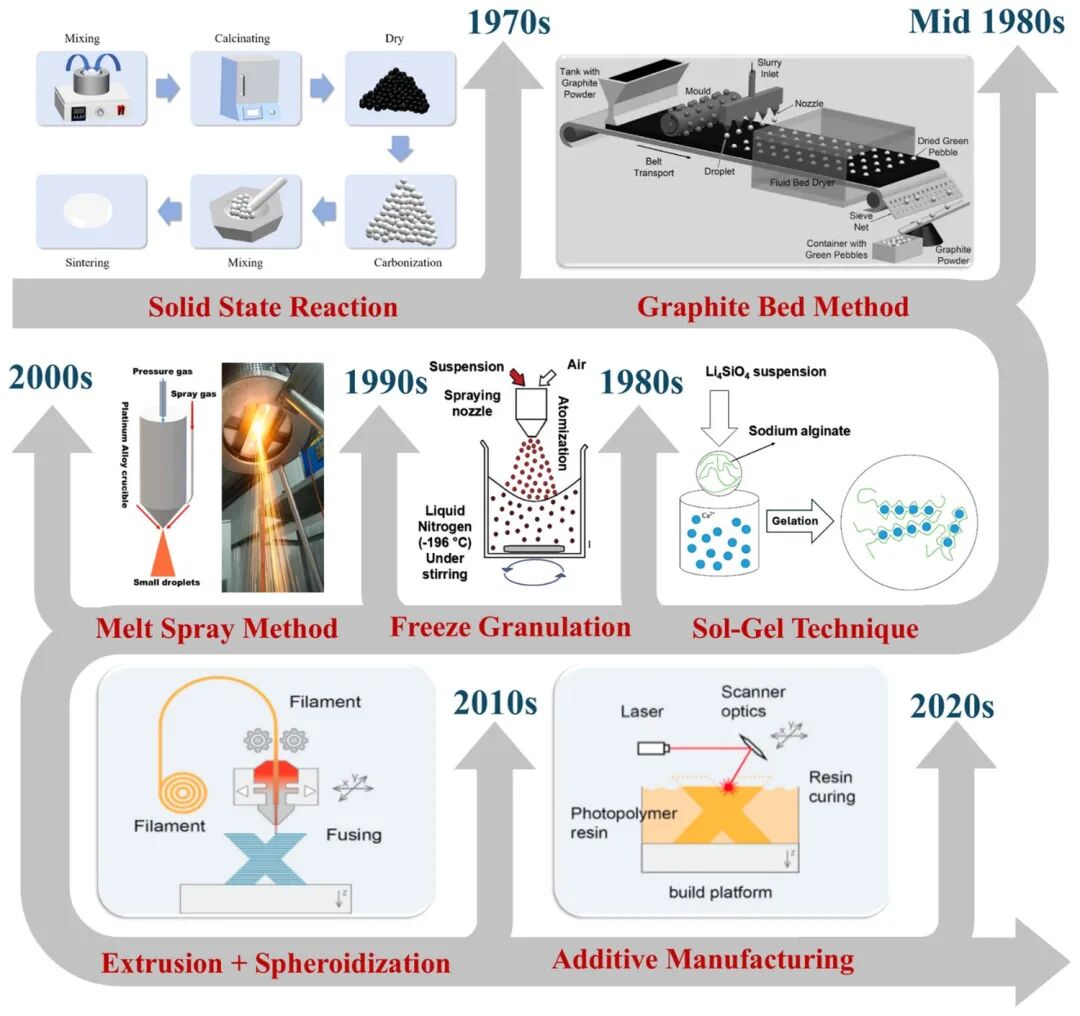
3.1 Solid-state reaction
This route is attractive for cost, batch scale and reproducibility, but control of shape, size and porosity can be limited and lithium loss must be assessed. The text cites LTO at 83% relative density and 45 N. It associates this example with 800 °C, whereas its comparison table states 1000 °C; that temperature discrepancy is unresolved.
3.2 Sol–gel processing
Sol–gel routes support chemical homogeneity and controlled morphology at comparatively low synthesis temperature. Their drawbacks include multiple steps, reagent cost and sensitivity to humidity. The narrative quotes a sphericity index of 1.04 and 89% relative density; Table 2 gives another representative LTO entry at 90%, with a 25–40 N crushing load.
3.3 Graphite-bed processing
Graphite-assisted coatings and core–shell concepts can limit lithium loss and stabilize dimensions. The source reports 104.79 N for an LTO–LSO example. Carbon contamination, graphite degradation and heat-transfer uniformity on scale-up remain concerns.
3.4 Freeze granulation
Freezing slurry droplets in liquid nitrogen helps retain a uniform shape and reduce cracking. A Li4TiO4 example is reported at 750 °C with a crushing load of 41 ± 2.5 N. Energy use, refrigeration equipment and scale-up cost are the main limitations.
3.5 Melt spraying
Atomizing a melt can form dense pebbles directly and may avoid a separate binder-removal step. The narrative cites a sphericity index of 1.027 and a 71.6 N load; Table 2 lists a different LSO result at 95.1% density and 21.63 ± 5.63 N. High equipment cost, Li2O volatility, oxidation and thermal stress are concerns. These separate examples should not be merged into one optimized process.
3.6 Extrusion–spheronization
Extrusion followed by spheronization offers scalable control of size and formulation, with binder removal and internal pores as important constraints. LSO is reported at 85% relative density and 17 N; an example with 5 wt% Li2ZrO3 reaches 30 N. The review discusses typical conventional-process ranges of 70–90% relative density, 10–60 N and 95–98% sphericity, with a cited minimum size around 1.3 mm. Those ranges are not universal limits: some individual examples above fall outside them.
Table 2. Conventional-process examples, not matched-condition comparisons
| Route | Material | Relative density (%) | Crushing load (N) | Reported sintering temperature (°C) | Advantages | Limitations |
|---|---|---|---|---|---|---|
| Solid-state | Li2TiO3 | 83 | 45 | 1000 | Cost, batch scale, phase purity | Shape control, lithium loss, pores |
| Sol–gel | Li2TiO3 | 90 | 25–40 | 1100 | Homogeneity, morphology control | Steps, cost, humidity |
| Graphite bed | Li2TiO3–Li4SiO4 | — | 104.79 | 1100 | Stable dimensions, uniform heating, recoverability | Carbon, graphite degradation, scale-up |
| Freeze granulation | Li4TiO4 | — | 41 ± 2.5 | 750 | Roundness, uniformity, fewer cracks | Energy, equipment, scale-up |
| Melt spray | Li4SiO4 | 95.1 | 21.63 ± 5.63 | 700 | Direct forming, density, low contamination | Cost, oxidation, thermal stress |
| Extrusion–spheronization | Li4SiO4 | 85 | 17 | 950 | Integrity, scale, flexible composition | Binder removal, internal pores |
4. Vat photopolymerization: from pebbles to designed structures
VPP includes stereolithography (SLA) and digital light processing (DLP). Light initiates crosslinking in a ceramic-loaded resin, creating a green body that is subsequently debound and sintered. DLP uses a digital micromirror device to expose a layer pattern, combining geometric control with layer-wise production. The review separates four linked stages: slurry preparation, sliced-model printing, binder removal and ceramic sintering. Temperatures depend on composition and formulation; its approximate 1200 °C sintering reference is not a universal recipe.
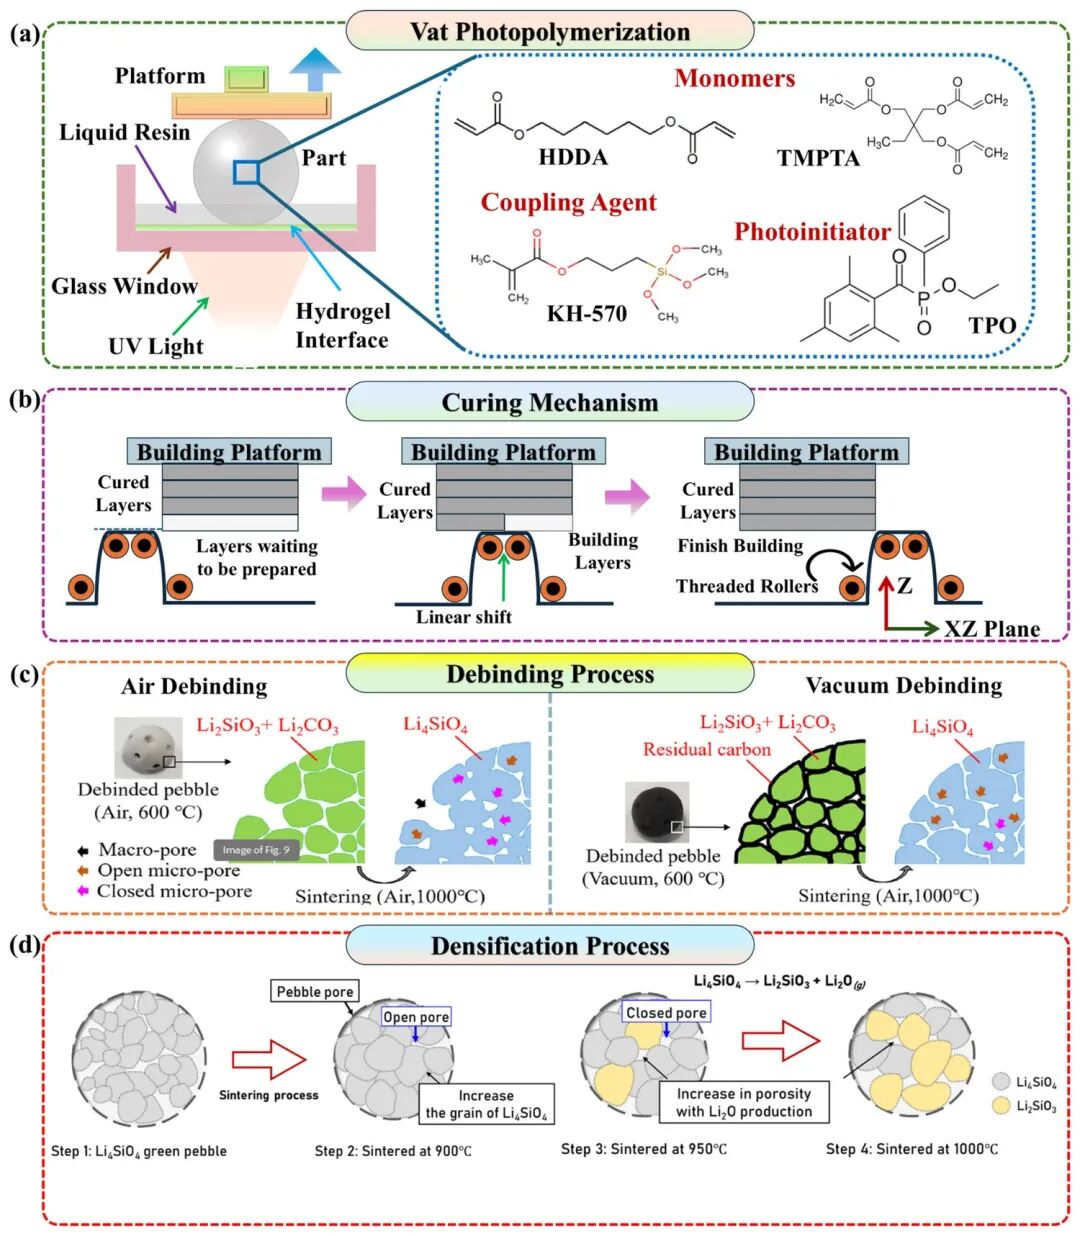
Post-processing affects chemistry as well as shape. For Li2SiO3 + Li2CO3 precursor systems, the source compares air and vacuum binder removal around 600 °C, with differences in phase evolution and grain structure. For LSO, argon debinding can leave more residual carbon and lower crushing resistance than air in the cited comparison. These observations are study-specific and do not establish one atmosphere as best for every material.
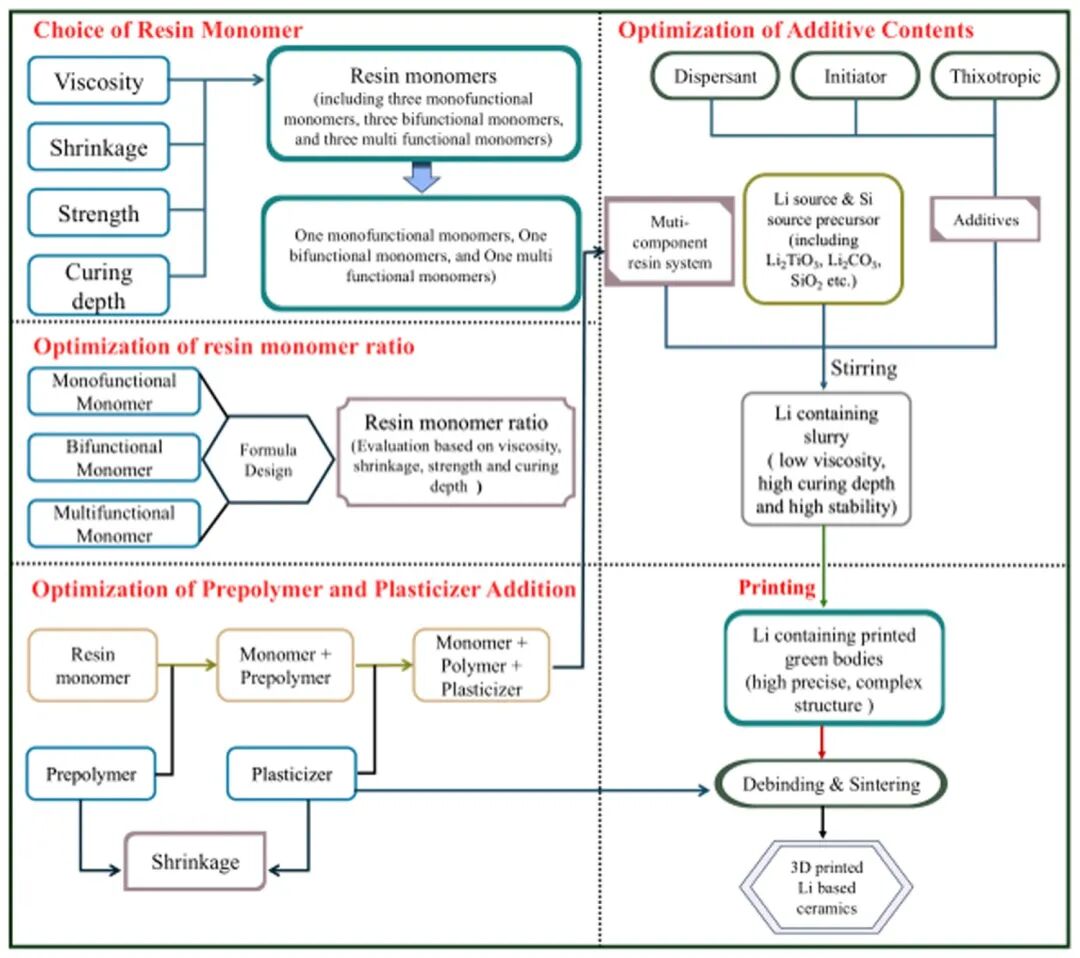
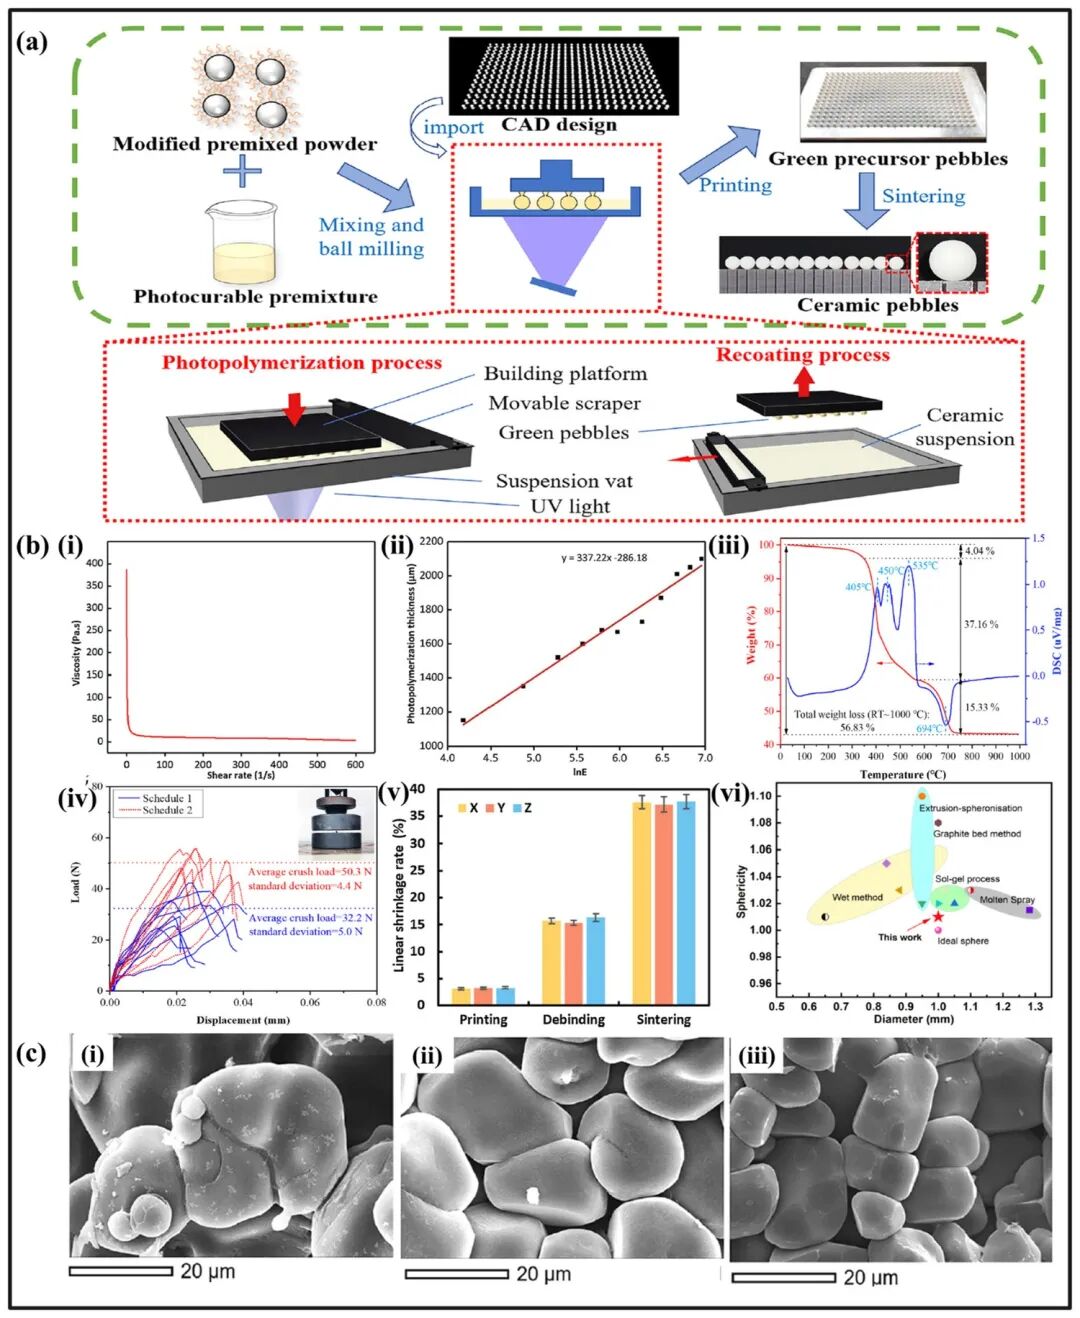
The formulation must balance viscosity, polymerization shrinkage, green strength and cure depth. Monomers, oligomers, photoinitiators, dispersants and rheology modifiers interact. Ratios of mono-, bi- and multifunctional monomers, together with prepolymers and plasticizers, affect crosslinking and dimensional change. Figure 4 connects these choices to printing, debinding and sintering rather than treating resin selection as an isolated step.
5. Powder and slurry requirements for VPP
Powder is the functional ceramic phase. Fine particles can improve packing and sintering, but increased specific surface area also raises viscosity and dispersant demand. Near-spherical particles generally flow and recoat more readily than angular, agglomerated powders. The text discusses particles around 0.1–0.5 μm as one fine-powder example, while Table 3 contains wider material-specific intervals up to 5 μm. Neither range should be treated as a single mandatory specification.
The source discusses specific surface area around 2–10 m²/g, high purity and solids loading around 40–60 vol%. Increasing solids can reduce later shrinkage and support density and accuracy, but makes rheology and recoating harder. Single-phase and mixed-phase powders may disperse differently. LTO is described as favourable in rheology; LSO needs surface and dispersion control; Li2ZrO3 offers thermal stability, while Li2SiO3 may show weaker resin compatibility. Table 3 retains the broader intervals and the ≥98% purity exception stated for Li2SiO3.
Table 3. Source-reported powder windows
| Material | Particle size (μm) | Morphology | Specific surface (m²/g) | Purity (%) | Dispersion |
|---|---|---|---|---|---|
| Li4SiO4 | 0.5–5.0 | Spherical / near-spherical | 3–10 | ≥99 | Moderate–good |
| Li2TiO3 | 0.2–3.0 | Near-spherical | 2–8 | ≥99 | Good; favourable rheology |
| Li2SiO3 | 0.5–5.0 | Near-spherical | 0.5–5 | ≥98 | Moderate; lower resin compatibility |
| Li2ZrO3 | 0.5–4.0 | Angular to near-spherical | 0.5–4 | ≥99 | Good; high thermal stability |
6. What DLP studies have demonstrated
In the illustrated route, modified premixed powder and photocurable resin are dispersed by mixing and ball milling, followed by CAD-based printing and post-processing. Exposure affects cured thickness and green-body integrity. The cited LSO thermal analysis reports 4.04% mass loss below approximately 350 °C and 37.16% between roughly 350 and 600 °C, with residual-carbon removal at higher temperatures around 600–750 °C. These are observations from the illustrated formulation, not a transferable furnace programme.
The plotted sequence shows shrinkage increasing from printing through debinding to sintering. Consequently, roundness and final dimensions must be assessed after the full process, not only on the green body. Figure 5 compares viscosity, cure thickness, thermal behaviour, load–displacement response, directional shrinkage and sphericity. The illustrated DLP result lies near the ideal-sphere reference in that comparison.
Reported relative densities span approximately 65.3–93.6% across the selected structures. Mechanical results include force in newtons and stress in megapascals; 15.24 MPa and 2000.3 N cannot form one strength range. Geometry, specimen dimensions, porosity and test method differ. Table 4 keeps the original units to prevent an invalid ranking.
Table 4. DLP structures and reported results
| Material | Geometry | Dimensions | Debinding atmosphere / sintering (°C) | Maximum relative density (%) | Reported mechanical result |
|---|---|---|---|---|---|
| LSO | Porous cellular body | 10 × 10 × 10 mm³ | Air / 1050 | 85.4 | 130.58 N |
| LSO | Rectangular lattice | 11.5 × 11.5 × 11.5 / 40 × 5 × 5 mm³ | Air / 1050 | 92.72 | 186.49 MPa |
| LTO | Sphere | Radius 1 mm | Air / 1150 | 93.6 | 113 N |
| LSO | Sphere | Radius 1 mm | Air / 1000 | 91.47 | 25.7 N |
| LSO | Radially porous sphere | Diameter 3 mm | Argon / 1000 | 92.28 | 39.33 N |
| LSO | Lattice | 10 × 10 × 10 mm³ | Air / 950 | 65.31 | 15.24 MPa |
| LSO–LTO | TPMS | 6 × 6 × 6 mm³ | Argon → air / 1100 | 92.9 | 98.7 N |
| LSO–LTO | Cubic unit | 7.3 × 7.3 × 7.3 mm³ | Air / 1150 | 92.8 | 2000.3 N |
| LSO | Octet truss | Unit 3.3 mm | Air / 750 | — | 83.6 N; CO2 adsorption study |
7. Why complex geometries matter
The reviewed examples include cubic cells, supported pebble arrays, radial pores, triply periodic minimal surfaces (TPMS), graded porosity, lattices and octet trusses. For a biphasic TPMS comparison, air, argon and an argon-to-air sequence correspond to 91.2%, 89.4% and 92.9% relative density and 85.2, 73.4 and 98.7 N crushing loads, respectively. Diamond performed favourably among Gyroid, Diamond and I-WP in the illustrated comparison; a reported Diamond result is 35.1 MPa. This is not evidence that Diamond is universally best.
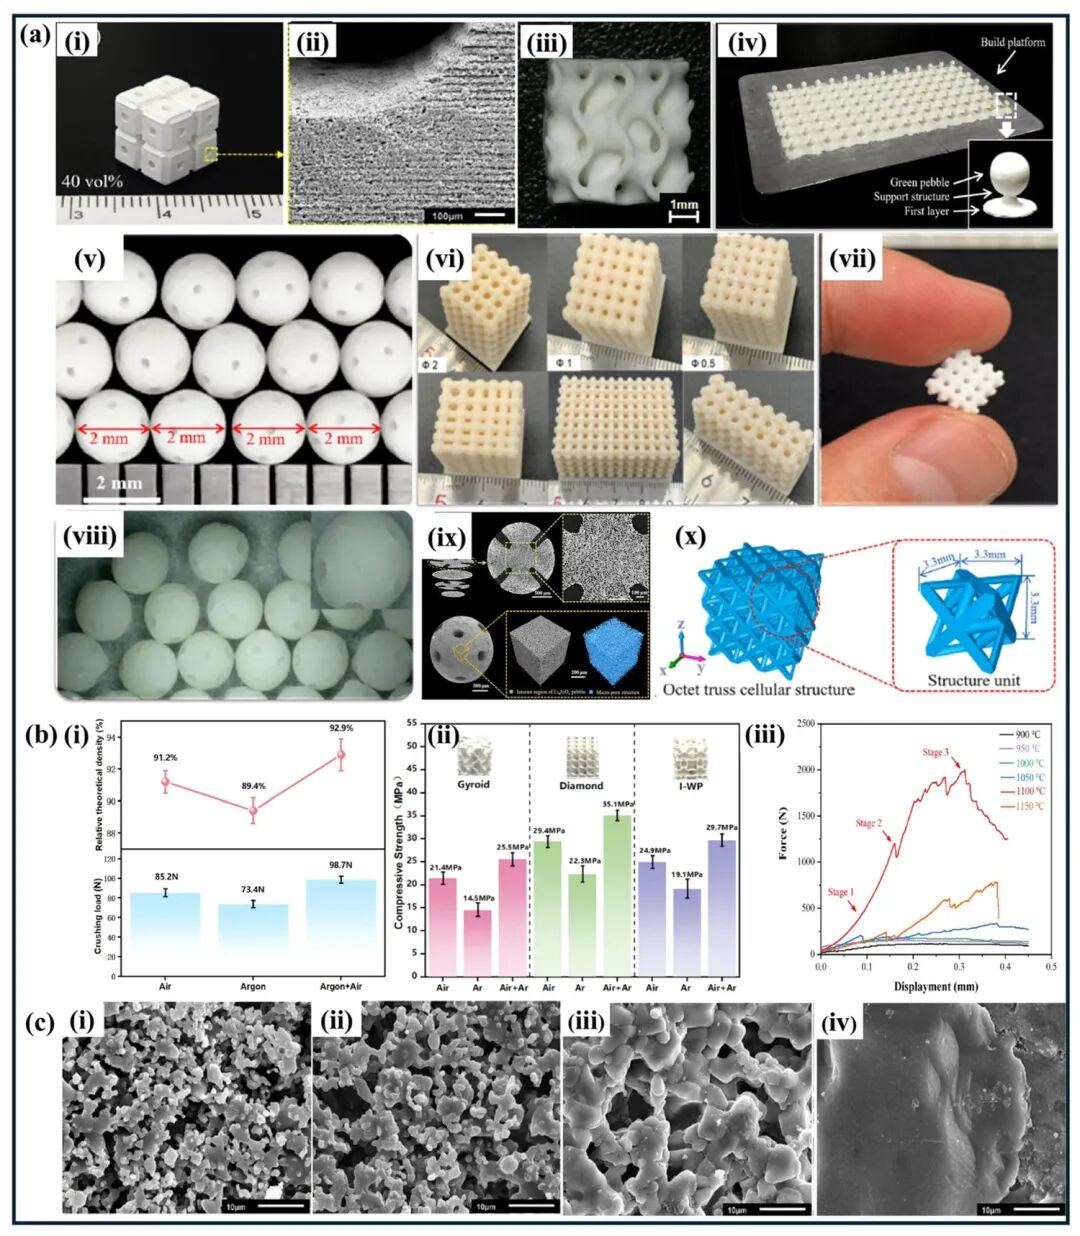
The narrative reports a biphasic cubic structure near 92.8% relative density and about 2000 N at 1100 °C, while Table 4 gives 1150 °C and 2000.3 N; the source discrepancy requires checking against the underlying experiment. Other examples include lattices printed with a 25 μm layer thickness and packing fractions of 42.3–79.55%, radial micrometre-scale channels, and a 3.3 mm octet-truss unit studied for CO2 adsorption. The latter concerns a different application, not reactor qualification.
The source also mentions non-VPP approaches: selective laser sintering of LTO with a reported 43 N result at 1100 °C, and piezoelectric droplet forming of LTO with 10.5% porosity, 5.9 μm grains and 22.9 N at 1000 °C. Differences in specimens and tests prevent a simple cross-process ranking. Toroidal or flattened shapes, a denser exterior with a porous interior, and digitally defined contact networks offer research directions for coupling transport and strength, while reducing unnecessary material use.
8. Remaining challenges and research directions
The review groups unresolved problems into low density and high shrinkage; cracking and internal voids; broad particle or pebble size distributions and anisotropic contraction; and lithium loss during thermal treatment. Proposed research directions include powder and sintering control, microwave-assisted processing, thermomechanical modelling, controlled pore architecture, cooling-rate studies, digital compensation and slurry optimization. Lithium-rich precursors, atmosphere control, vapour compensation, rapid thermal processing and soft-chemistry synthesis are discussed as research concepts, not validated operating instructions.
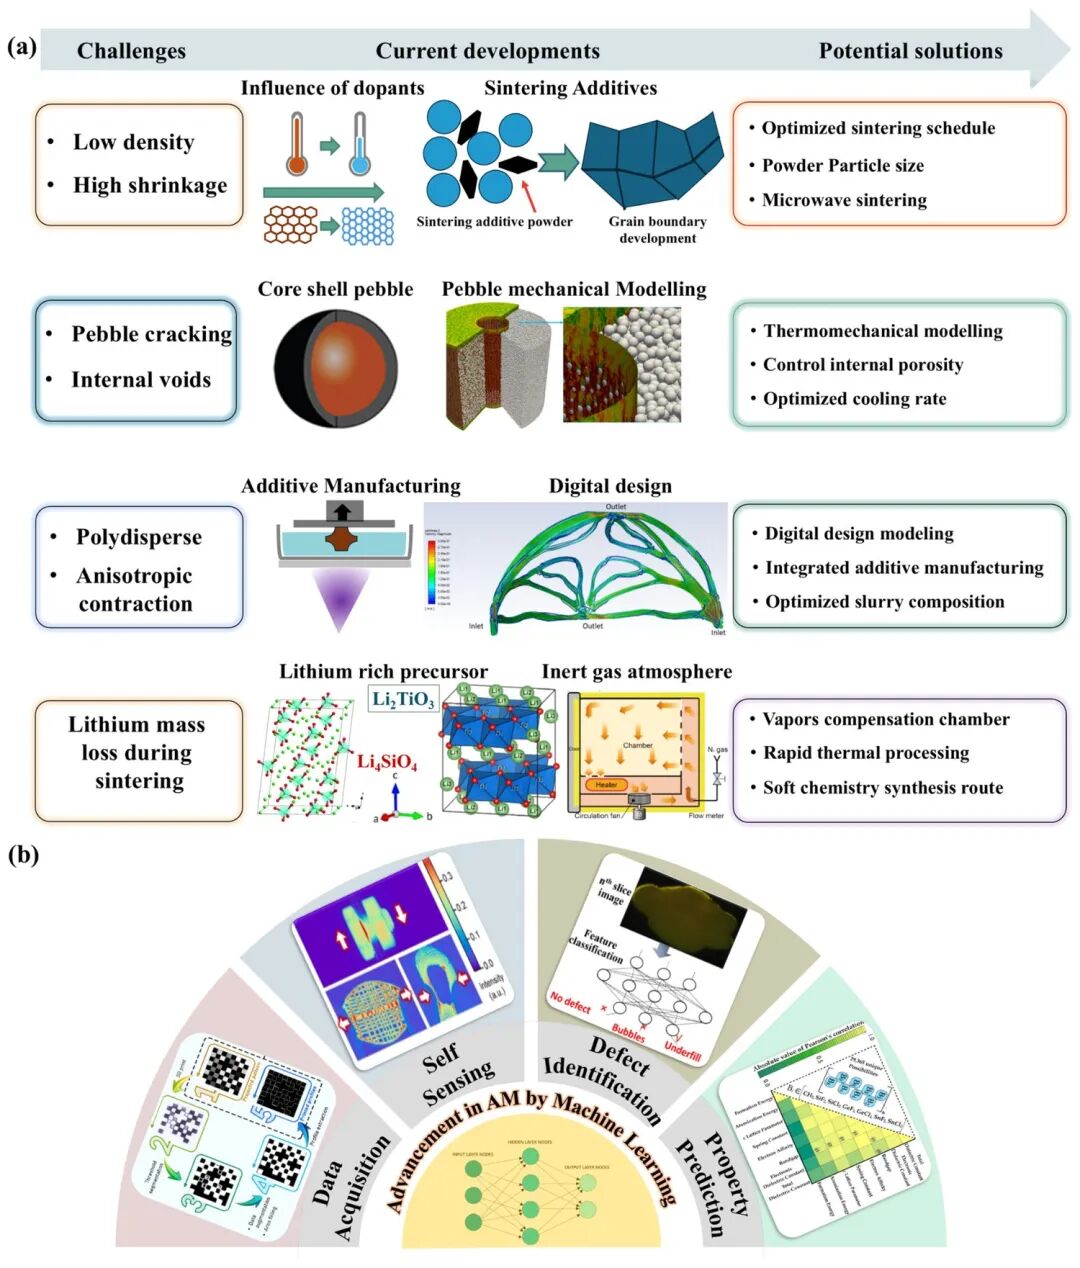
Three wider directions connect these issues. First, hybrid manufacturing may combine conventional compositional uniformity with additive geometric freedom. Second, simulation needs experimental validation under irradiation and thermal cycling, supported by reproducible material data. Third, data-driven process monitoring may link exposure, layer thickness, separation speed, slurry rheology and thermal history to defects and microstructure. Machine learning could assist detection of bubbles, undercuring, delamination and overcuring, but useful closed-loop control requires trustworthy training data and physical validation.
9. Conclusions: evaluate the complete manufacturing chain
The central message is not simply that DLP can make rounder pebbles. It makes deliberately structured ceramics possible, linking composition, slurry, printing, debinding, sintering and geometry. The source contrasts typical conventional figures of 70–90% relative density and 95–98% sphericity with selected VPP examples around 85–95% density, ≥99% sphericity and 0.8–1 mm size. These broad source summaries use differing definitions and specimens; they are not guaranteed capability limits or a matched comparative trial.
Most results remain laboratory-scale. Long-term irradiation stability, phase evolution, release kinetics, cyclic mechanical life and reproducibility need further evidence. Standardized windows for lithium loss and residual carbon are also missing. Material-specific validation, hybrid routes, simulation and measured-data feedback are therefore more meaningful next steps than treating a high single-specimen load as proof of reactor readiness. None of the research figures here is a KUNWU equipment specification or certification.
Editorial checks and source limitations
Tables and technical figures retain the supplied source values and original image content. Read lithium density separately from ceramic density, and load (N) separately from stress (MPa). The 64% packing statement refers to random packing, not all arrangements. Table 1 lists Li2ZrO3 at 1888 K and LiAlO2 at 1883 K, so the source narrative’s claim that LiAlO2 has the highest melting point is not repeated. The 800/1000 °C and 1100/1150 °C discrepancies are explicitly noted above rather than silently resolved. A dash means no value reported, not zero. Publisher metadata assigns the review to volume 47, issue 1 (January 2027), article 118724; this website’s preparation date is separate from the journal issue date.
Sources
Original paper · DOI
Ali U, Arshad Q, Hussain M I, Hu Q, Saqib M, Raza M, Ali D, Ye Z, Chen Z. Advances in production of lithium-based ceramics for nuclear fusion applications. Journal of the European Ceramic Society. 2027;47(1):118724.