Materials research
Where do defects go during alumina 3D-print sintering?
Pores shrink, but interlayer defects can persist. A research-based guide to X-CT evidence, sintering windows and directional shrinkage in ceramic vat photopolymerization.
Research interpretation, not a KUNWU material specification. Numerical details are attributed to the supplied technical report; the paper identity and central conclusions were checked against the publisher’s abstract and accessible sections. Diagrams are original explanatory graphics, not micrographs or CT reconstructions.
1 · Sintering changes defects; it does not reset the part
A ceramic print can retain its external shape while containing pores or thin separations between layers. A 2026 study by Zhang and colleagues examined how these internal defects evolve during sintering of vat-photopolymerized alumina. Its practical message is that density and strength alone do not reveal which defects remain. Slurry preparation, exposure, interlayer bonding and debinding must be considered together with the furnace cycle.
The supplied technical report describes 4 × 4 × 4 mm X-CT specimens, a reconstructed voxel size of 2.4 μm, temperatures from 1500 to 1650 °C and holds of 1–4 h. X-CT provides a three-dimensional view that complements surface microscopy and fracture examination. A detected-defect volume fraction is not the same measurement as total porosity: features below the scan resolution or segmentation threshold may not be counted.
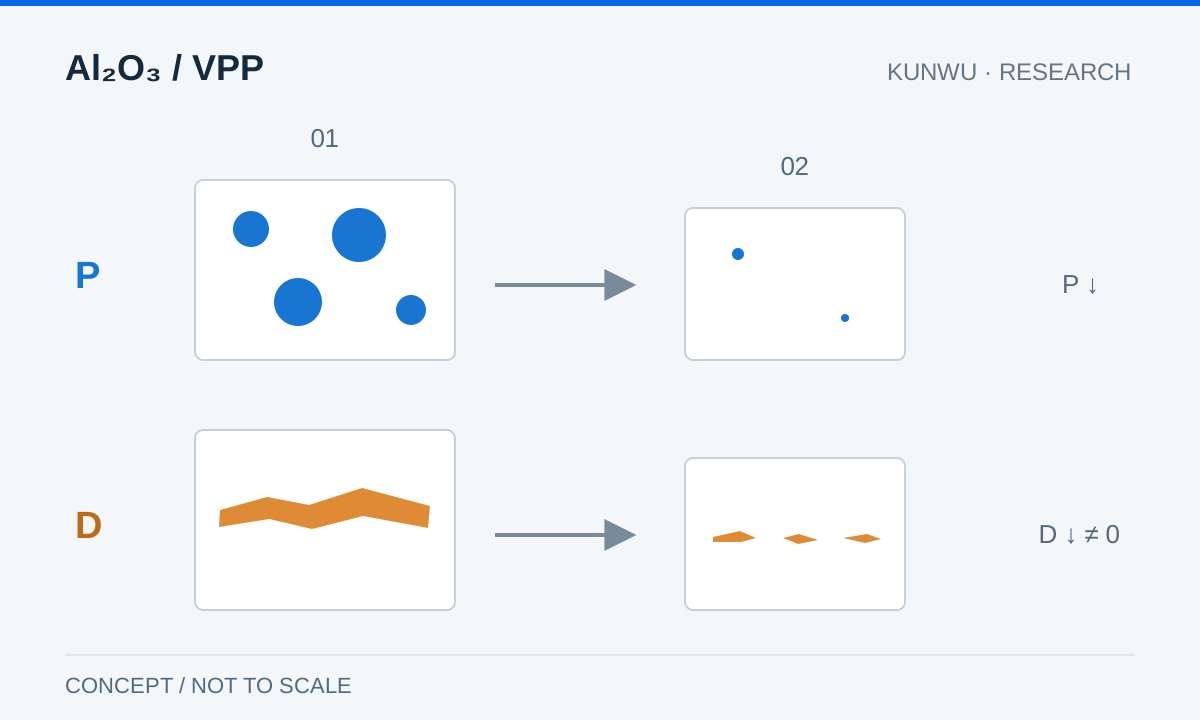
2 · Pores and delamination follow different paths
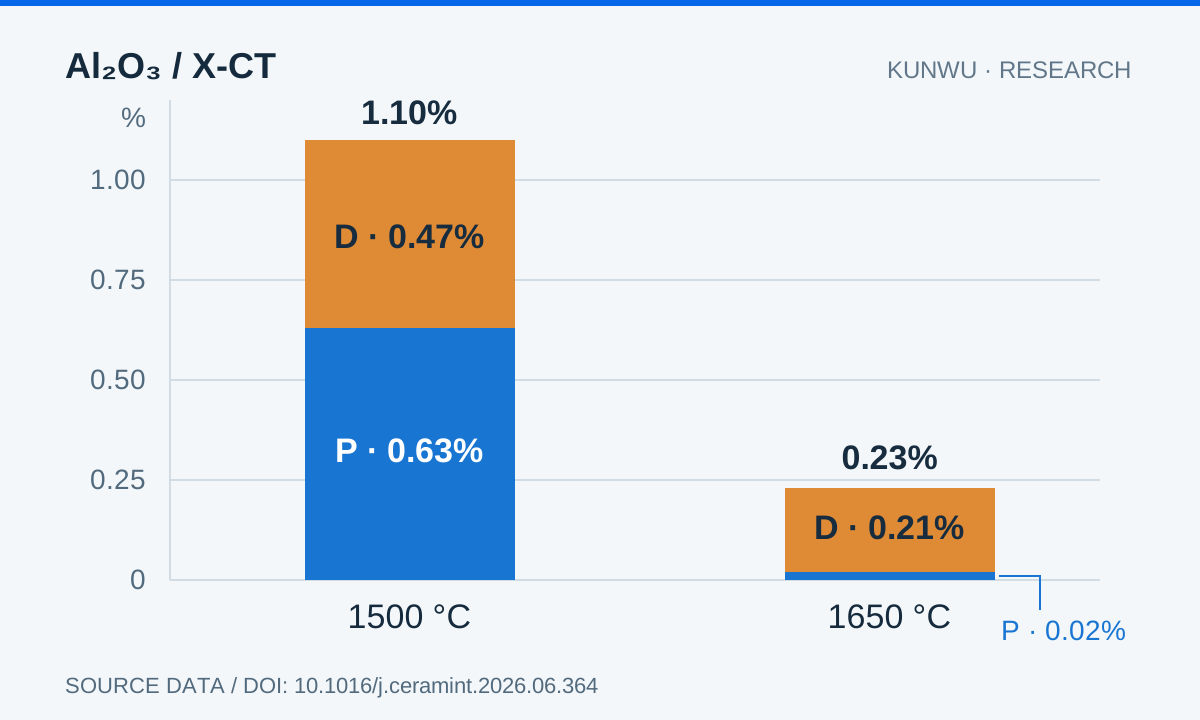
In the reported temperature comparison, the detected total defect fraction fell from 1.10% to 0.23%. Pores decreased from 0.63% to 0.02%, whereas delamination decreased from 0.47% to 0.21%. Thus about 91% of the detected defect volume at the higher-temperature endpoint was still delamination (0.21 ÷ 0.23; calculated from the reported values). A low overall defect fraction can therefore hide a persistent interlayer problem.
The study describes shrinkage, separation and disappearance of delamination defects. Small, comparatively uniform gaps may close; larger uneven gaps can divide into smaller defects, some of which remain. This is a description of the studied specimens, not a rule that every pore disappears or that every delamination is irreparable. For production, preventing a large interlayer defect is preferable to assuming that a hotter furnace will heal it.
| Detected defect volume | 1500 °C | 1650 °C |
|---|---|---|
| Pores | 0.63% | 0.02% |
| Delamination | 0.47% | 0.21% |
| Total | 1.10% | 0.23% |
3 · A temperature window, not a universal recipe
For this formulation, the reported best condition was 1650 °C for 3 h: flexural strength 350.37 ± 13.18 MPa and relative density 96.63%. The lower-temperature result was 112 ± 5.04 MPa at 1500 °C. Extending the highest-temperature hold to 4 h did not improve strength in the reported comparison. Longer holding is therefore not automatically better; grain growth, residual pores and dimensional change must also be assessed.
The slurry used 50 vol% solids, a coarse/fine alumina blend and MgO/TiO₂ sintering additives. These details matter: a different powder, binder, additive system, wall thickness or furnace loading can shift the useful processing window. Neither 350 MPa nor 1650 °C is a KUNWU equipment guarantee. The reported approximately twofold strength gain refers to the process-optimization comparison, not to a simple ratio of every temperature endpoint.
4 · Compensate shrinkage by direction
At 1650 °C for 3 h, the report gives different linear shrinkages along x, y and z, with z being the build direction. A single scale factor would ignore this anisotropy. If shrinkage s is measured relative to the green dimension, the idealized enlargement factor is 1 / (1 − s), not 1 + s. The factors below are calculations from the reported mean values, not calibrated settings for another printer.
Validate compensation using coupons printed in the intended orientation and processed with the intended support and thermal cycle. Record green and sintered dimensions at the same locations. Thin walls, long channels, support friction and nonuniform heating can cause distortion that a global scale factor cannot correct.
| Axis | Linear shrinkage | Calculated scale |
|---|---|---|
| x | 18.91 ± 0.15% | ≈ 1.233 |
| y | 19.52 ± 0.16% | ≈ 1.243 |
| z | 21.52 ± 0.20% | ≈ 1.274 |
5 · Read strength together with the test conditions
The reported three-point bending specimens measured 3 × 4 × 36 mm, with a 30 mm span, loading at 0.5 mm/min and ten specimens per group. The report places the build direction along the 3 mm height. Build direction and load orientation affect how a layer defect is stressed, so a strength result from one orientation does not establish equal performance in every direction. Compare like-for-like specimens and loading when qualifying a new application.
6 · Turn the result into a validation plan
For a practical trial, separate four records: slurry preparation and air removal; layer formation and bonding; debinding and gas escape; sintering and dimensional change. When residual delamination dominates, revisit the earlier stages instead of raising temperature alone. Compare external geometry, density, directional shrinkage, fracture behavior and, where justified by the component risk, internal defects. Use CT resolution appropriate to the defect size you need to detect.
For an equipment or sample discussion with KUNWU, send the material system, approximate part dimensions, minimum wall/channel dimensions, required properties and expected batch size. These inputs help define a representative trial and its acceptance criteria before selecting equipment. This article provides an engineering reading of published research; it does not certify a production process or promise the study’s values for a customer part.
Sources
Original paper · DOI
Keqiang Zhang, Qiaoyu Meng, Zhaoliang Qu, Rujie He. Defect evolution in vat photopolymerization additive manufactured Al2O3 ceramics during sintering: Correlation with microstructure and mechanical properties. Ceramics International (2026). DOI: 10.1016/j.ceramint.2026.06.364.