Process engineering
Rheology recovery as a DIW printability metric
Beyond yield stress, post-shear recovery rate matters because it controls filament retention and multilayer stability.
This KUNWU editorial note is based on the supplied technical source. Reported results belong to the described study or sample and are not KUNWU equipment specifications.
DIW (Direct Write Extrusion) technology is moving from the laboratory to industrial mass production. Formula design is the core competitiveness, and quantifying and predicting the "printability" of slurries is the key threshold for industrialization. The most commonly used criterion in the industry is yield stress - but this study from the University of Liverpool tells us that for two strontium titanate (STO) emulsion gels with almost the same yield stress, one has excellent printing accuracy, while the other is a mess. The gap is not in strength, but in the "toughness" of the microstructure - the gap between the recovery rate of 78% and 38% is the hidden password that determines the success or failure of printing.
How pH changes the microstructure of otherwise similar gels
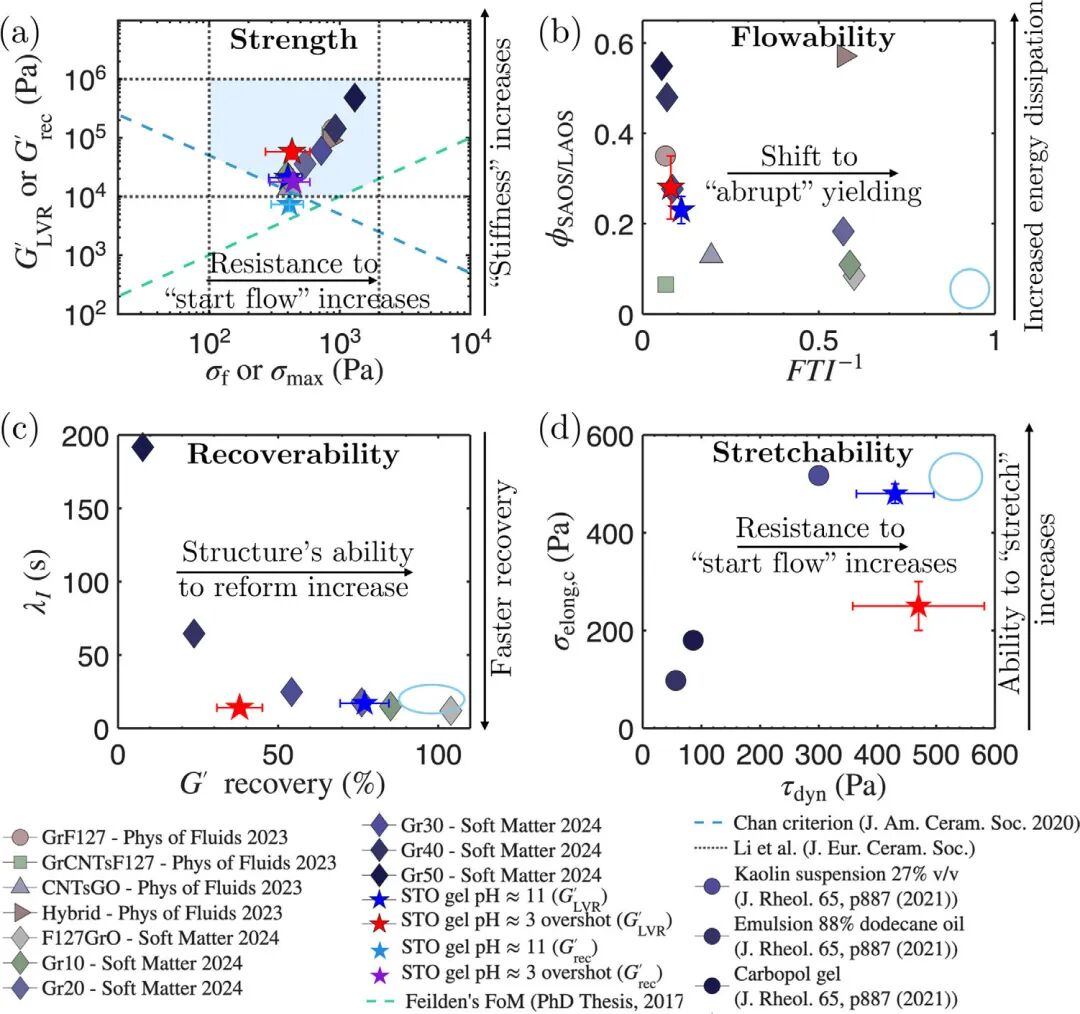
The printability of DIW slurry is usually evaluated from four dimensions: strength (whether it can support the shape), fluidity (whether it can be squeezed out or not), recovery (whether it can quickly solidify after extrusion), and stretchability (whether it can continue to be stretched). But most formula evaluations only stop at the first dimension, adding a yield stress value to claim to be "printable".
This work has designed a pair of "twisted twins" plasma: SrTiO3, STO emulsions from the same formulation, which is designed to give a completely different microstructure through pH. The formulation core is a pH-responderated copolymer surfactant BCS L5, STO solid content 47 vol per cent. At 11 pH ≈, the lyric acid matrix of BCS L5 was deprotonized to form balanced and stable physical gels through electrostatic-space position resistance to double stabilization. When pH down to 3 (below pKa≈6.5.5), aluminum-based protonation, trigger inter-molecular/intrahydrogen key assembly, STO particles and oil droplets are assembled into clusters to form an exotic, unstable concentration network.
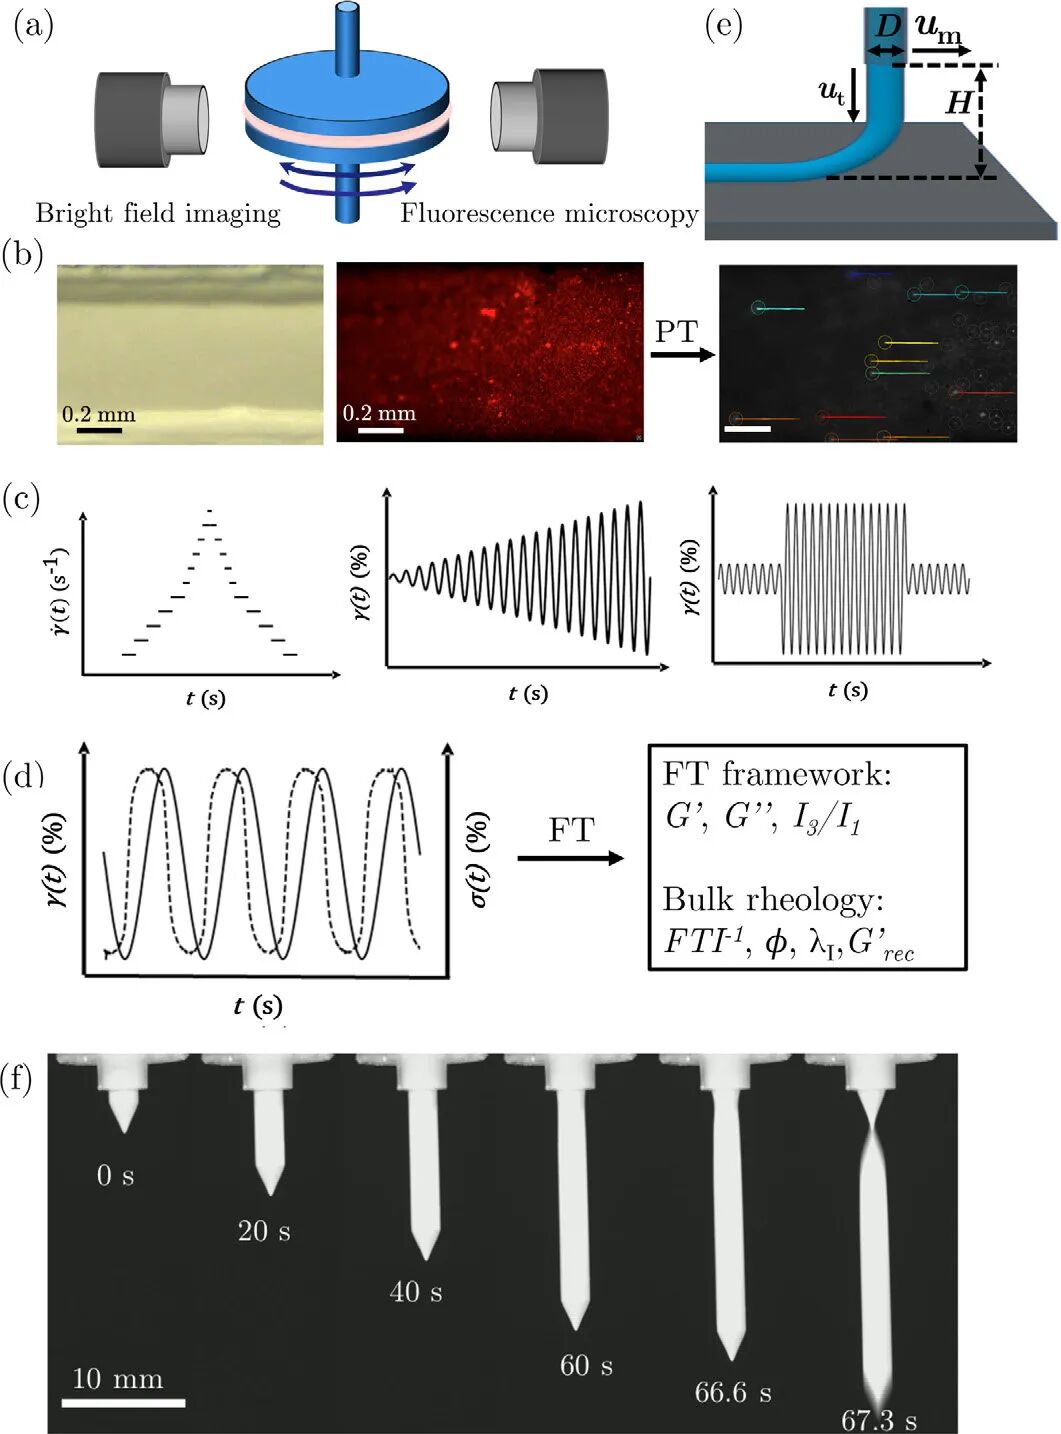
Similar yield stress does not mean similar flow stability
Looking first at the results of the most commonly used continuous shear test, it can be clearly seen that the dynamic yield stress of the two gels is highly similar: 430±70 Pa for pH≈11 and 470±110 Pa for pH≈3, with almost no difference within the error range. Judging by this metric alone, the two slurries appear to be equally matched.
However, rheology microscopy revealed the cruel fact: Although there are wall slips and shear bands in the pH≈11 gel during the shearing process, the overall flow is close to pure plasticity (flow index n≈0.09), and each shear rate step can reach a steady state. However, the pH≈3 gel experienced strong wall slippage and continuous microstructural destruction. The stress continued to decrease at each step and could never reach a steady state, and even had a negative flow index (n≈−0.08). Continuous shear gives "averages that look reasonable but completely mask microscopic scale collapses."
LAOS: stress overshoot and energy-dissipation signatures
Structural differences that cannot be distinguished by continuous shear begin to emerge in the LAOS (Amplified Oscillatory Shear) test. LAOS detects the entire transition process of materials from elastic solid to viscous fluid by gradually increasing the oscillation strain amplitude (0.01% → 100%).
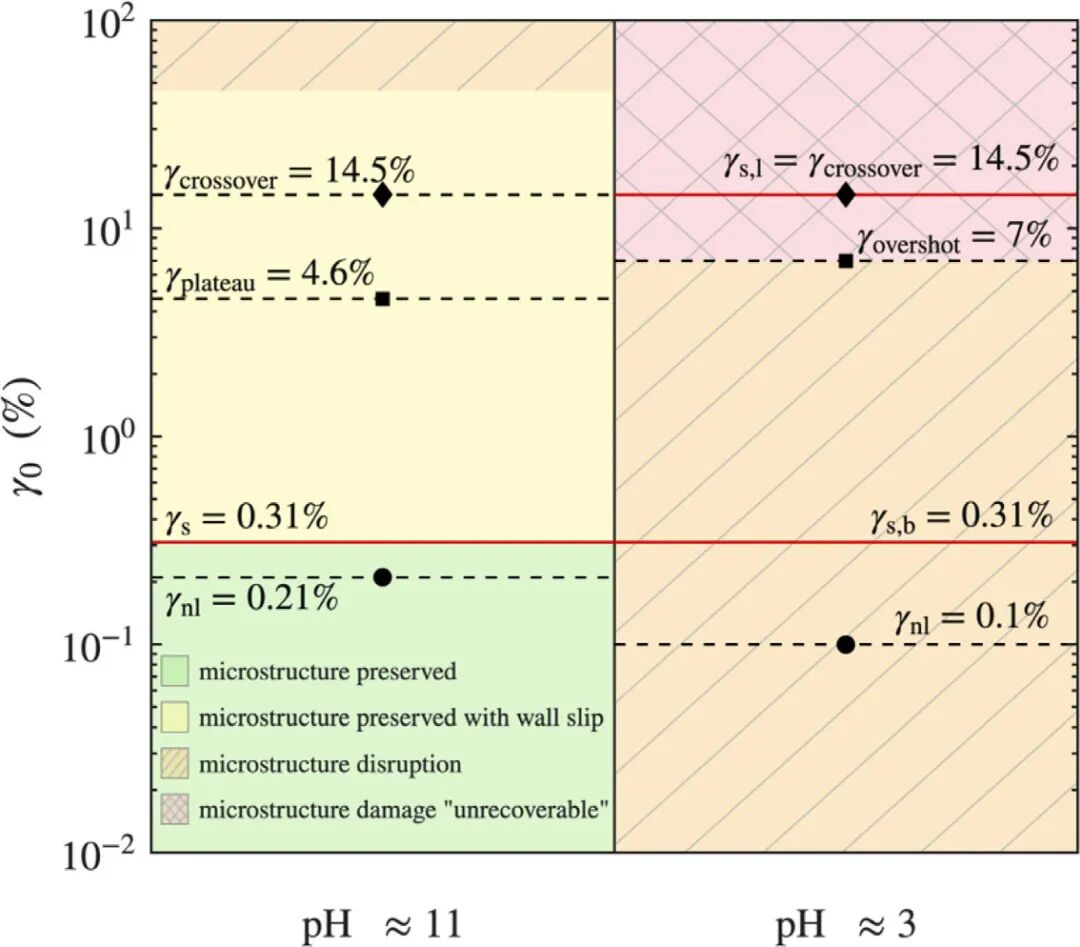
Both STO gels exhibit Type I thinning, but the details are completely different. The storage modulus G' of the pH≈11 gel in the LVR is 20,900±3,600 Pa. The shear stress increases monotonically with strain and enters bulk flow at the modulus crossover point (γ=14.5%). The energy dissipation ratio φ increased smoothly from 0.18 to 0.63. The standard deviation of the four independent experiments was extremely small, and the data were highly consistent.
On the other hand, for pH≈3 gel, G' is as high as 57,900±160 Pa in the LVR (hydrogen bond assembly makes the network more "rigid"), but there is a stress overshoot (σmax=440±160 Pa) in the flow transition zone γ≈7%, and φ appears at a local extreme value, and then rises sharply. After crossing the overshoot point, the experimental uncertainties of G', G'' and σ₀ increase sharply, which reflects the inconsistent performance of microstructural damage between different tests. Stress overshoot and dissipation anomalies are not test noise, but "fingerprints" of irreversible collapse of the microstructure.
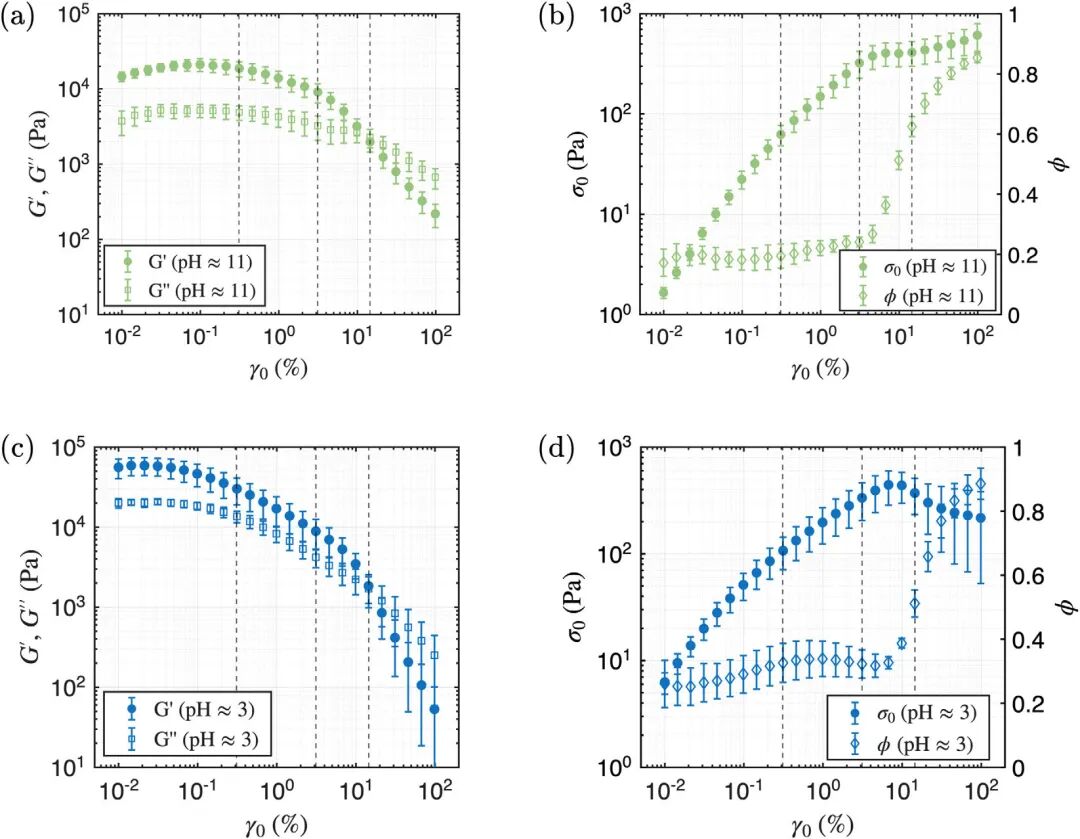
Rheomicroscopy directly follows microstructural changes
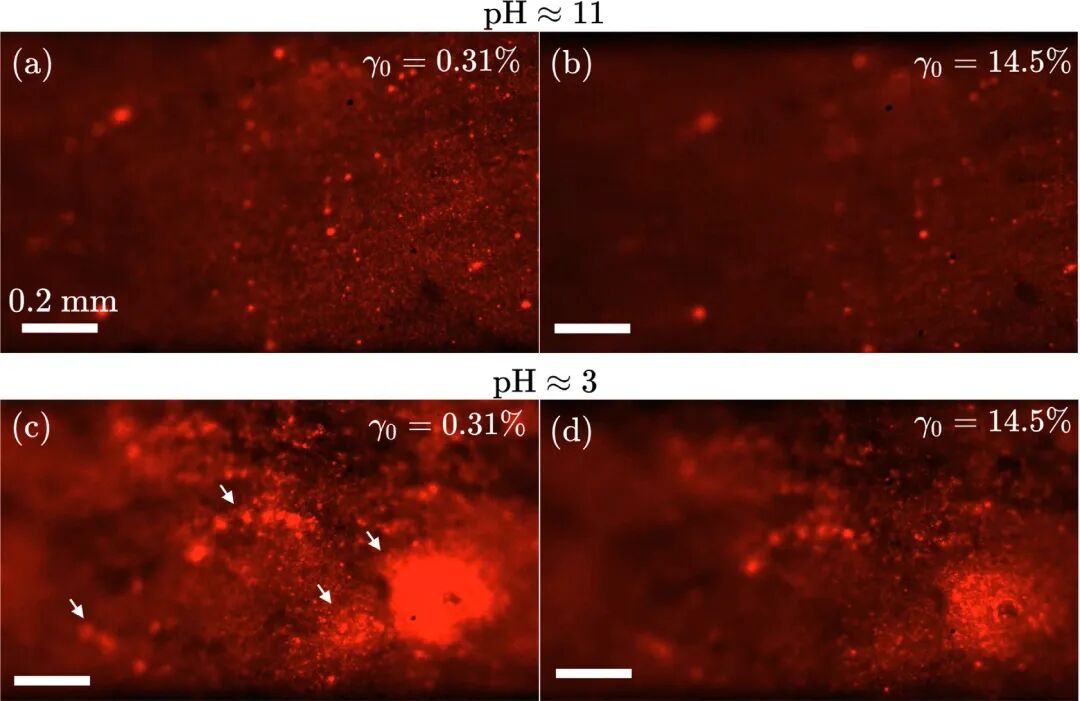
If LAOS can detect "fingerprints", rheology microscopy provides image evidence. During the LAOS test, a fluorescence microscope simultaneously recorded the morphological changes of the oil phase (the oil phase was fluorescently stained with Nile Red).
In the pH≈11 gel, the NR-labeled decane droplets are uniformly dispersed, and even under the maximum strain of LAOS (γ₀=14.5%), the microstructure remains highly uniform: there is no coalescence of droplets and no phase separation. In contrast, for pH≈3 gel, when γ₀ is only 0.31%, a large number of large droplets (with a diameter of up to about 0.33 mm) have appeared, and a large dark area (no oil phase area) appears in the fluorescence image. When the strain continues to increase, the droplets further coalesce, collapse and disappear, and finally form a decane lubricating layer at the parallel plate interface. The gel with pH≈3 does not "flow" but gradually disintegrates during deformation.
Particle tracking (PT) complements this picture from a quantitative perspective: the displacement curve of the pH≈11 gel remains highly linear (R²>0.97) at all strain amplitudes, and although there is double-wall slip, the slip amount is small and uniform; while the linearity of the pH≈3 gel is only R²=0.56 at γ₀=0.31%, which is due to the local difference in stiffness of the heterogeneous microstructure and the formation of a slip lubrication layer at the bottom under large strains.
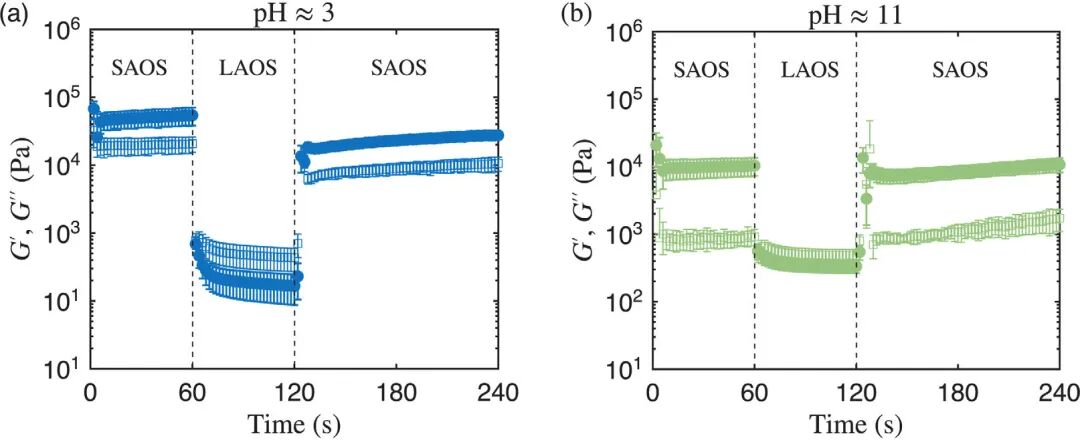
3ITT recovery: 78% versus 38%
The three-interval thixotropy test (3ITT) simulates the complete "pressure-release" process of DIW: first measure the initial solid-state stiffness (60s) with a very small strain (γ₀=0.02%), then destroy the structure with a large strain (γ₀=50%) and enter the "liquid state" (60s), and finally return to a small strain to observe recovery.
The results are extremely contrasting. pH≈11 gel: Although G′ falls below 1 kPa instantaneously and G′′ > G′ (“liquid”) in the LAOS range, the microstructure remains intact and there is no aggregation of droplets (fluorescence confirmation). After returning to SAOS, it quickly returned to the solid state, with a recovery rate of 78% and a mutation time of λI=16.7 s. pH≈3 gel: also experienced liquefaction, but the recovery rate was only 38% (λI=14.1 s). The reason for the difference lies not in the recovery speed (the two are similar), but in the "ceiling" of recovery: the pH≈3 gel undergoes irreversible decane polymerization and phase separation in the LAOS range, and the destroyed microscopic network can never come back.
Behind the figure "recovery rate 78% vs 38%" is a more essential rule: the key to the printability of DIW ceramic slurry is not how high the original stiffness is, but whether the microstructure can "come back" after severe shearing.
Extensional behavior: ductile necking versus brittle fracture
In addition to shear flow, stretchability is another dimension that is often overlooked in DIW. The Gravity Extensional Rheometer (GER) drives the syringe to extrude the filament at a very slow speed and records its entire process from self-weight stretching to fracture.
The pH≈11 gel exhibits the classic yield stress fluid stretching behavior: during the stretching process of about 10 seconds, a progressive necking is formed near the nozzle, the wire diameter slowly decreases at a rate of about −9 μm/s, and finally enters the "solid-liquid" transition at the critical extension stress σelong,c=480±20 Pa, and breaks like a "pencil tip". The microstructure remains stable during the entire process, and the necking area experiences the classic path of elastic deformation → yielding → plastic flow.
The pH≈3 gel completely deviates from the above behavior: the wire diameter thinning rate is only about −0.7 μm/s, and even weak extrusion swelling (die swell) occurs after extrusion. The filaments are bent laterally, the surface is rough, and the fracture occurs near the nozzle in the shape of a "lipstick head", which is a brittle fracture rather than ductile yielding. Its extension critical stress is only σelong, c=250±50 Pa, which is significantly lower than the pH≈11 gel. This also stems from its unstable heterogeneous microstructure: decane phase separates during stretching, lubricating the surface of the filament and causing early fracture.
Five maps form a design-rule framework
The study drew the above four rheological dimensions (strength, fluidity, recovery, and stretchability) into printable maps, and added a "microstructural evolution phase diagram" based on microscopic observation, forming a five-dimensional evaluation framework.
| Printability map | Axes | pH≈11 | pH≈3 | Distinguishes gels? |
|---|---|---|---|---|
| Strength | G′ vs σf | Meets four criteria | Meets four criteria | No |
| Flow | φ vs FTI⁻¹ | φ=0.23, FTI⁻¹=0.11 | φ=0.28, FTI⁻¹=0.08 | No |
| Recovery | G′ recovery vs λI | 78%, 16.7 s | 38%, 14.1 s | Yes |
| Extension | σelong,c vs τdyn | 480±20 Pa | 250±50 Pa | Yes |
| Microstructure | γ₀ vs pH | Intact to γ₀≈46% | Damage begins within LVR | Yes |
Table 1 · Comparison of five-dimensional printability evaluation frameworks: Strength and flowability maps alone cannot distinguish the two gels, while recovery, stretchability, and microscopic phase maps can effectively separate
Key findings are here: while the first two maps (strength + mobility) do not distinguish between the print properties of the two gels, the last three maps (restorability + stretchivity + microstructure phase) clearly capture the nature of the differences. The pH≈11 gel is printed with a high degree of precision not because it is "stronger" or "fresh" but because its microstructure is able to maintain completeness, efficient recovery, and tensile extension fractures after large deformations.
Printing-parameter phase diagram: five deposition modes
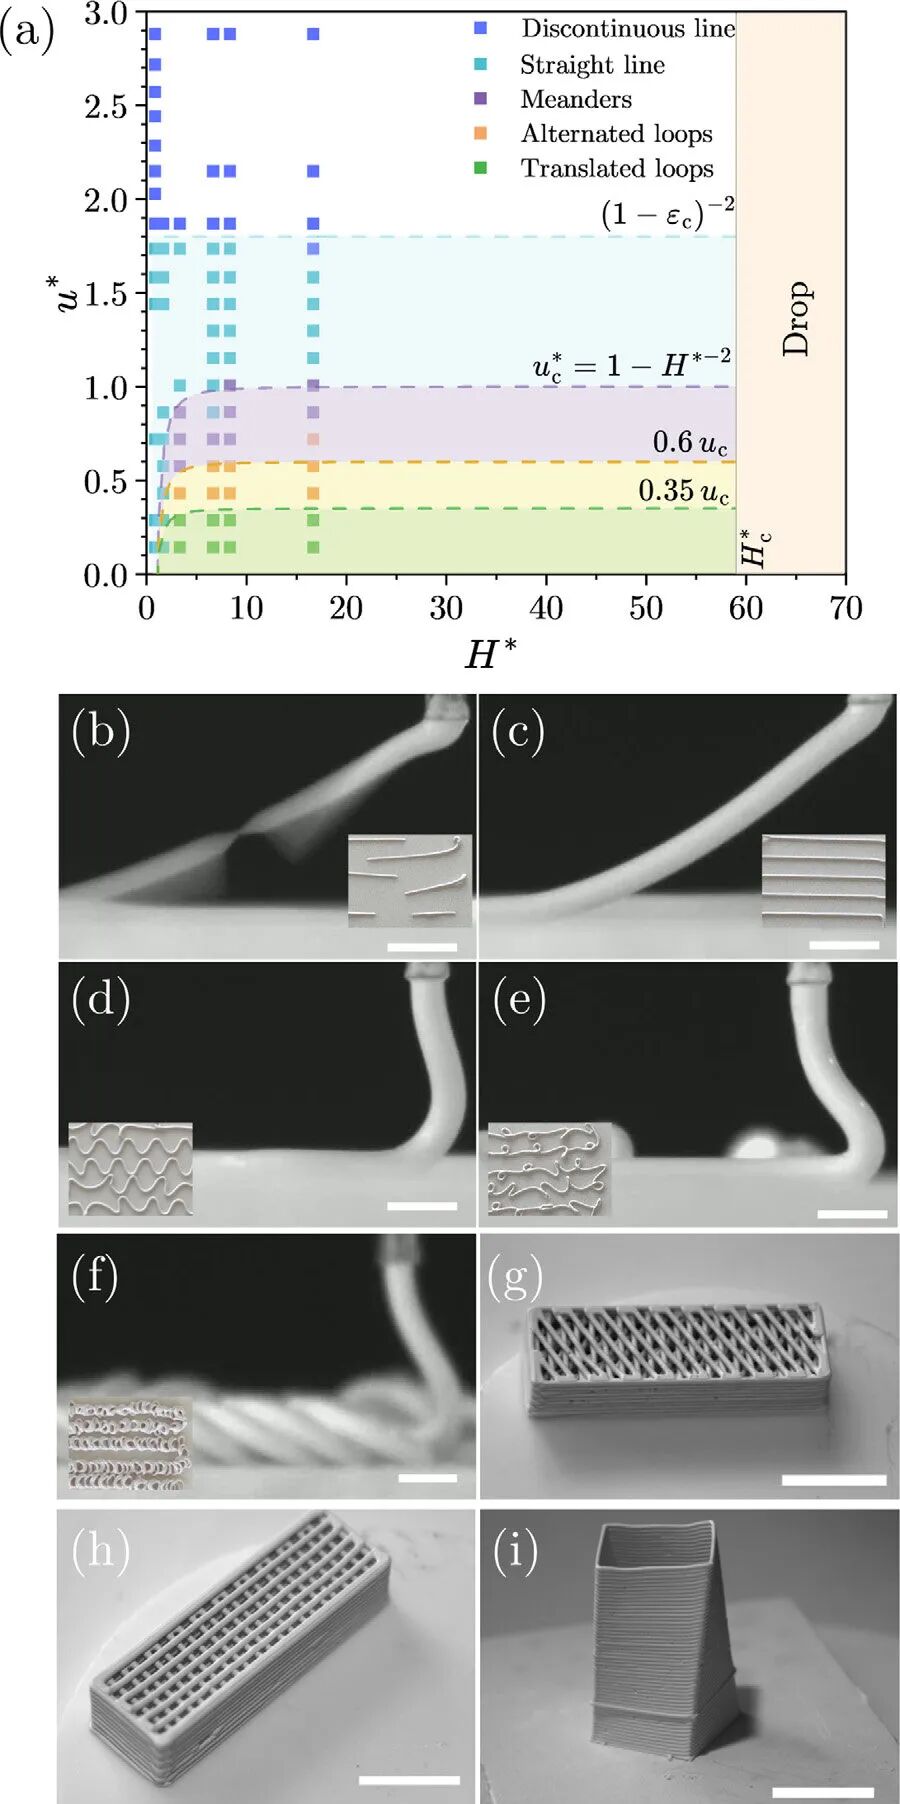
After the formula is determined, the printing parameters also determine success or failure. Based on the optimized gel with pH≈11, the study drew a phase diagram of printing parameters by changing the extrusion speed ut and nozzle movement speed um, combined with the nozzle-substrate distance H. The horizontal axis is the dimensionless speed ratio u*, and the vertical axis is the dimensionless height ratio H*.
The experiment confirmed five deposition modes: discontinuous filaments (too small u* leads to tensile fracture), straight filaments (optimal window, u*≈1, H*≈1), meanders, alternated loops, and translated loops, all of which are highly consistent with theoretical predictions based on other yield stress fluids in previous literature. The straight yarn mode is divided into stretched state (1
Under optimal parameters (ut=2.4 mm/s, um=2 mm/s, H=0.5 mm, D=0.51 mm), two porous lattice structures (30° and 90° alternating grid paths) and a 51-layer spiral square tower (side length 10 mm) with each layer rotated 0.5° were successfully printed, demonstrating the application potential of STO emulsion gel in high aspect ratio, three-dimensional complex structure DIW.
DIW printability needs five-dimensional assessment
The study gives a clear signal at the methodological level: it is far from sufficient - and possibly misleading - to assess the printability of the DIW slurry by relying only on the yield or the storage energy module. PH3 gels of strength met by all standards, with a printing effect far less than the pH11 gels of partial deviation from the strength criteria.
What deserves more attention is the upgrade path of methodology. LAOS, 3ITT and GER provide a complete set of "rheological mandarin", using available bulk parameters (FTI⁻¹, φ, λI, G′ recovery rate, σelong,c) to describe the performance of the slurry at each stage of the entire printing process. The introduction of rheological microscopy has advanced this "language" from the phenomenon level to the mechanism level: it can directly see the flow instability hidden in continuous shear, the microstructure damage corresponding to stress overshoot in LAOS, and the root cause of the recovery rate difference in 3ITT (reversible deformation vs. irreversible phase separation).
For DIW ceramic 3D printing formulators, this framework provides a practical decision-making path: first use LAOS+3ITT+GER for bulk screening (high-throughput, low-cost), and then use a rheological microscope to deeply dissect the microscopic mechanism of candidate formulas with similar performance - to find the structural code behind the recovery rate that "looks similar" but is actually twice as different.
Reference papers
Luo Z, Agrawal R, Flynn S, García-Tuñón E. Mapping and connecting bulk rheological criteria and microstructure evolution of printable ceramic gels for direct ink writing. Additive Manufacturing. 2026;127:105269. DOI: 10.1016/j.addma.2026.105269