Applications
Strength prediction for β-TCP scaffolds
Modelling links porous-architecture parameters with the mechanical response of a bioceramic scaffold; it is a research tool, not a medical conclusion.
This KUNWU editorial note is based on the supplied technical source. Reported results belong to the described study or sample and are not KUNWU equipment specifications.
Why scaffold strength is difficult to predict
β-TCP (β-tricalcium phosphate) is a degradable bioceramic that is close to human bone minerals and is widely used in bone repair scaffolds, dental implants and skull reconstruction. DLP (Digital Light Processing) 3D printing can form a high-resolution, interconnected pore structure in one piece, which exactly fits the pore topology required for bone tissue to grow in. This combination of "design flexibility + high precision" makes DLP increasingly competitive on the bone scaffold track.
However, as soon as the stent enters the field of load-bearing bone repair, the first thing engineers encounter is not "can it be repaired?" but "can it be carried after being repaired?" β-TCP itself is highly brittle, and the stress distribution caused by different TPMS (three-period minimal surface) structures is greatly different. In addition, the DLP process itself brings "non-design" disturbances such as interlayer defects, uneven shrinkage, and internal holes, and the compressive strength becomes an extremely difficult to predict quantity. The traditional method is to "beat one piece, press one piece, and adjust again". One round can take as little as a few months or as long as a year.
The problem isn't just "slow". The TPMS family itself has two types: sheet (thin-walled type) and skeletal (skeletal type). It is divided into eight major topologies such as Diamond, Gyroid, I-WP, Fischer-KochS, Primitive, Split-P, Neovius, and PMY. Each type has porosity changes caused by adjustable wall thickness. The entire design space is huge, and each one needs to be traversed by printing + compression tests, which is unrealistic and expensive.
What Shuo Yin's team wants to do is very clear: instead of printing again and again, can we first use statistics + finite element to "calculate" the strength; can it even be extrapolated when the structure and porosity change? This is their latest work published in the International Journal of Mechanical Sciences.
Weibull statistics, finite elements and cumulative damage
The team split the problem into three parts and used three types of tools to solve it.
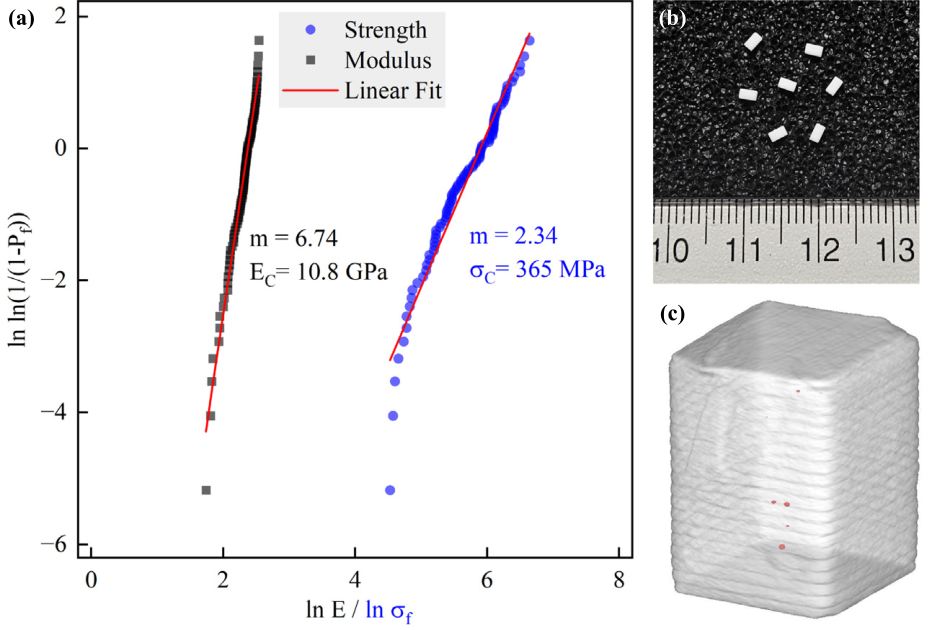
The first piece is the material intrinsic strength. The brittle fracture of β-TCP naturally has data dispersion. To talk about "strength", we must first have statistical distribution. The team used the DLP process (Lithoz CeraFab 7500, LithaBone TCP 300 commercial slurry, 25 μm layer thickness, 168 mJ/cm² exposure, 1200℃ sintering) to prepare 86 dense blocks of 1.2×1.2×2.4 mm³. The measured Weibull modulus m=2.34 and the characteristic compressive strength σC=365 MPa; Young's modulus corresponds to m=6.74, EC=10.8 GPa. These two sets of numbers provide the calibration anchor point of "local material strength" for all subsequent architectural predictions.
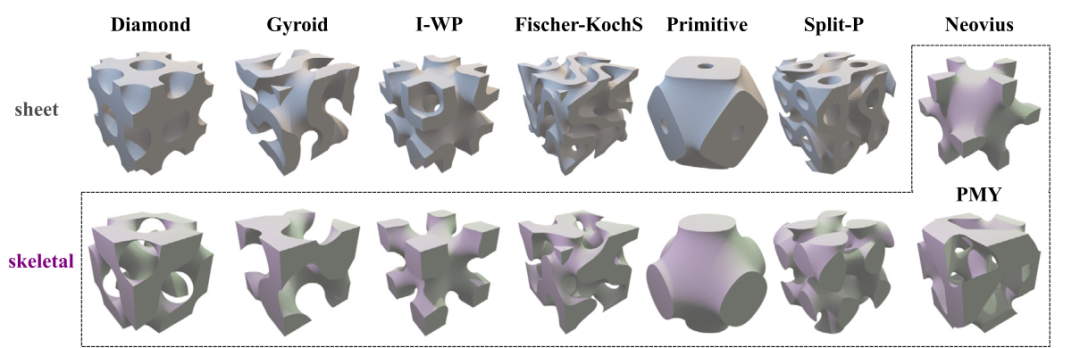
The second piece is the structural stress amplification effect. The same material placed in different TPMS units will have significantly different stress distributions. The team conducted finite element uniaxial compression simulations on 14 types of TPMS units with a target porosity of 50% (except for Neovius and PMY, which only retain the skeleton type, the other six types of topology all appear in pairs of sheet / skeletal, a total of 14 types), and extracted the maximum principal stress-volume distribution (SCF-Volume distribution) of each architecture. This is equivalent to quantifying "geometrically induced stress concentrations" into a calculable and comparable fingerprint.
The third block is the failure criterion. The team compared various brittle fracture criteria such as maximum principal stress, Drucker-Prager, Mises stress, and shear stress, and finally determined that maximum principal stress is the most accurate and consistently ranked failure criterion, which is consistent with the physical image of ceramic tensile side fracture. Coupled with a cumulative damage criterion of "critical failure volume fraction" - when the failure volume in the structure reaches a critical value, the overall failure is considered - the "geometric fingerprint" can be reversed into a "macro strength prediction".
The uncertainty of projections is also quantified: 95 per cent of the projection ranges are applied to each of the 14 structures by random sampling of the SCF-Volume distribution. In other words, the projection report is not just a strength figure, but a intensity drop point that gives designers a "worst case" judgement.
One calibration across 14 TPMS architectures and variable porosity
This prediction framework is "marked" and "validation" in two steps.
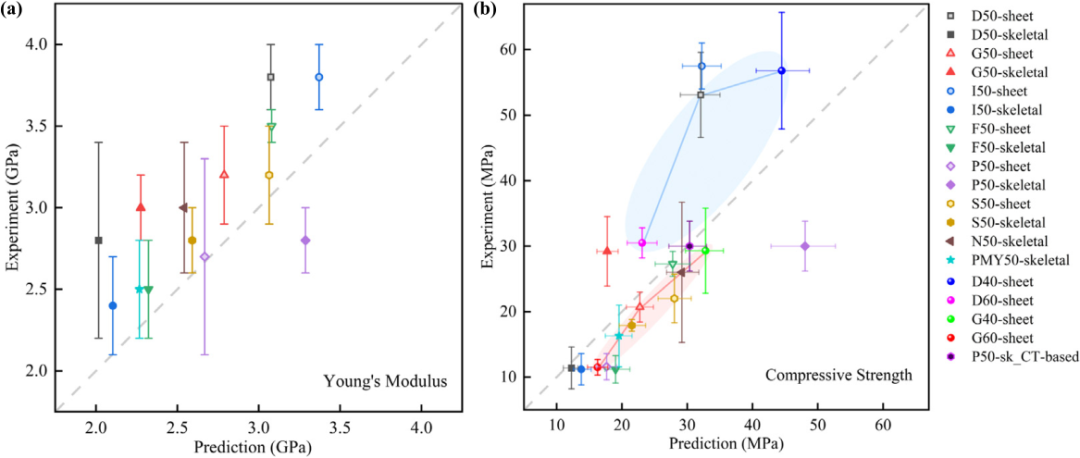
In the first step, 14 TPMS structures with 50% porosity are used for calibration: 7 standard compression samples of 4.0×4.0×8.0 mm³ are made for each structure, and uniaxial compression is performed to measure the measured strength; at the same time, finite element is run to obtain the predicted strength. Comparison of predictions vs. measurements shows that the maximum principal stress criterion is significantly better than other failure criteria in terms of ranking consistency.
The second step is to verify at the porosity level that is not involved in the calibration (two sheet topologies, D and G, are selected, each with two levels of 40% and 60%, namely D40/D60/G40/G60). Without refitting the parameters, the predicted results still fall within the 95% interval of the actual measurement. This means that this framework can be extrapolated in both dimensions of structure + porosity, and there is no need to run a large sample experiment every time a design is modified.
| TPMS architecture, 50% porosity | Compressive strength (MPa) | Young’s modulus (GPa) |
|---|---|---|
| I50-sh | 57.5 ± 3.5 | 3.8 ± 0.2 |
| D50-sh | 53.1 ± 6.5 | 3.8 ± 0.2 |
| P50-sk | 30.0 ± 3.8 | 2.8 ± 0.2 |
| G50-sk | 29.2 ± 5.3 | 3.0 ± 0.2 |
| F50-sh | 27.3 ± 1.9 | 3.5 ± 0.1 |
| N50-sk | 26.0 ± 10.7 | 3.0 ± 0.4 |
| S50-sh | 22.0 ± 3.7 | 3.2 ± 0.3 |
| G50-sh | 20.7 ± 2.3 | 3.2 ± 0.3 |
| S50-sk | 17.9 ± 0.9 | 2.8 ± 0.2 |
| PMY50-sk | 16.3 ± 4.7 | 2.5 ± 0.3 |
| P50-sh | 11.6 ± 2.0 | 2.7 ± 0.6 |
| I50-sk / D50-sk / F50-sk | ≈ 11.2–11.4 | 2.4–2.8 |
Table 1 · Compressive strength and Young’s modulus of 14 TPMS structures at 50% porosity (sh=sheet, sk=skeletal; the three structures in the last row have similar values and are listed together)
Just looking at the table, you can find a counter-intuitive phenomenon: at the same 50% porosity, the strength of I-WP sheet and Diamond sheet both exceed 50 MPa, and the Young's modulus reaches 3.8 GPa, which is twice as high as most skeletal structures. For the same topology, the sheet-to-skeletal intensity may drop directly from 50 MPa to 11 MPa - if the geometry is changed, the intensity will be 5 times different. It is difficult for designers to judge in advance if they only rely on experience. This just highlights the value of "geometric fingerprint" type predictions.
Tracing defects: how architecture controls cracks
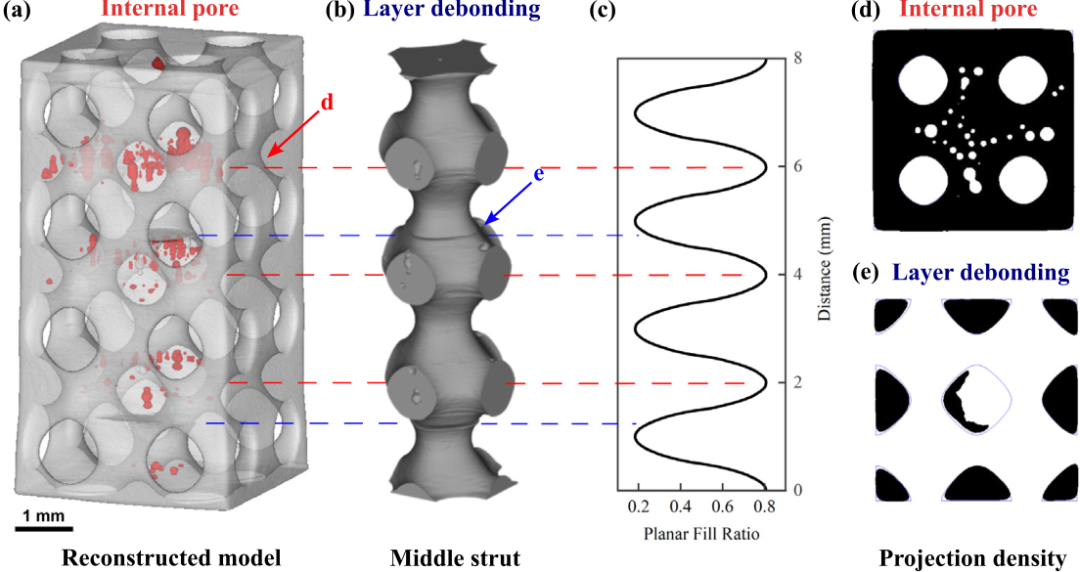
The predictions of ideal geometry are not perfect. Micro-CT reconstruction showed that residual deviations mainly come from macroscopic defects introduced by the process, and that these defects are not randomly distributed - the structure "selects" which types of cracks are most likely to develop.
The team summarized this phenomenon into two architectural descriptors:
① Dense ratio: The volume fraction of completely dense pixels in the "projected density" in the printing direction. The larger the density ratio, the better the vertical continuity and the higher the load-bearing capacity; but at the same time, the interface stress concentration is more obvious during degreasing and sintering, and the risk of interlayer debonding increases. The density ratios of P50-sk and G50-sk are both high, and interlayer cracks are indeed seen on micro-CT; although the density ratios of I50-sk, D50-sh, and PMY50-sk are not low, the density areas are more dispersed and do not form continuous "intra-layer columns", so the defect form turns to internal pores.
② Planar fill ratio: the maximum in-plane solid phase fraction in all printing layers. A high value means that the volume of a single layer shrinks more violently during degreasing, and internal stress caused by uneven shrinkage can easily accumulate in the layer and further evolve into internal holes.
Using these two as "defect selectors" can explain why the failure modes exhibited by different TPMS vary so widely. The team also used P50-sk to conduct a reverse verification: the "defect-containing" geometry reconstructed by micro-CT was directly fed to the finite element, and the prediction accuracy was greatly improved. This in turn proves that the reason why ideal geometry predictions are biased is not primarily a problem with the model itself, but rather the "wounds" left by craftsmanship hidden in the geometry.
Implications for bone repair
Putting this framework into the actual scene of load-bearing bone repair, there are three value points:
First, quickly screen the architecture. In the design stage of DLP ceramic 3D printing, engineers no longer need to do a round of printing + compression for every TPMS topology + wall thickness combination; instead, they use a prediction framework to first do a round of "strength sorting" on the computer to narrow the candidate architectures to 2-3 before running them on the computer. The development cycle can be significantly shortened.
Second, a report with uncertainty is given. The 95% prediction interval means that designers can get both "optimistic estimates" and "conservative estimates" at the same time, and have direct reference value for worst-case calibration of load-bearing parts - something that the past "single-point strength" reports could not provide.
Third, precipitate defect laws into design rules. The two descriptors of density ratio and plane filling ratio turn "which architecture is easy to debond and which is easy to have internal holes" into a quantifiable geometric indicator. Designers can in turn constrain the architecture selection based on load-bearing requirements. For example, the high density ratio area is controlled below a certain threshold to avoid the risk of interlayer cracks.
Of course, the team also admits the limitations of the current framework: only 7 specimens are used for verification per architecture, and the statistical sample size is limited; the anisotropy caused by the construction direction has not yet been incorporated into the model. These are all directions that can be supplemented in the future. The Yin team has disclosed all the data on Zenodo, and interested readers can directly reuse it for benchmark comparison.
For colleagues engaged in DLP ceramic 3D printing and bone scaffold research and development, this method is highly portable: changing a ceramic material and a set of TPMS architecture, the essential process remains unchanged. It not only solves the problem of "β-TCP strength prediction", but also pushes the issue of "mechanical reliability of ceramic 3D printed porous parts" to a position where engineering-level judgment can be made.
References
Zhao Y, Liu K, Lupoi R, Yin S. Strength prediction with defect analysis of DLP-printed β-TCP scaffolds. International Journal of Mechanical Sciences, 2026, 326: 111873.